
Fuel COVID-19 Consumer Sentiment Study Volume 7: The Tides Have Turned Again
by Melissa Kavanagh
We hope that you find the information useful. The survey was sent out on July 9, 2020, and received 5,200 responses. Below is a summary of the findings, along with some observations and opportunities that arise from the results.
Executive Summary
With the rise in reported COVID cases, travel sentiment has definitely seen a shift since our last survey. We asked a new question pertaining to the preference of mask ordinances in the respondents’ travel destination, and broke out many questions based on those responses. There is a clear divide in behavior. Below are the key points of this survey.
- There were equal numbers of people who want to go to a destination with a mask ordinance as those who do not want one.
- The topic of masks came up for the first time in both word clouds for feelings on traveling now, and when people will feel ready to travel.
- 63% of all respondents said the rise in COVID-19 is impacting travel plans for 2020.
- The propensity to travel within the next 3 months has decreased across the board. However, those who prefer to travel to a destination without a mask ordinance had more confidence in in this time frame.
- The number of people who could not be persuaded to book a vacation increased for the first time since the start of this survey series.
- 40%-60% of respondents were less likely to take all of types of vacations (hotel, VRBO, RV, etc.) because of the pandemic.
- We saw more people hesitant to make use of on-site amenities, with the likelihood of using an outdoor pool decreasing substantially. Again, there was quite discrepant data looking at the breakdown of mask preferences.
- Open air destinations and 2 hour drive locations are still far more likely to be visited in the near future, and even more so by those who prefer no mask ordinances.
1. If your desired destination implements a mandatory face mask ordinance, how will
this impact your travel plans?
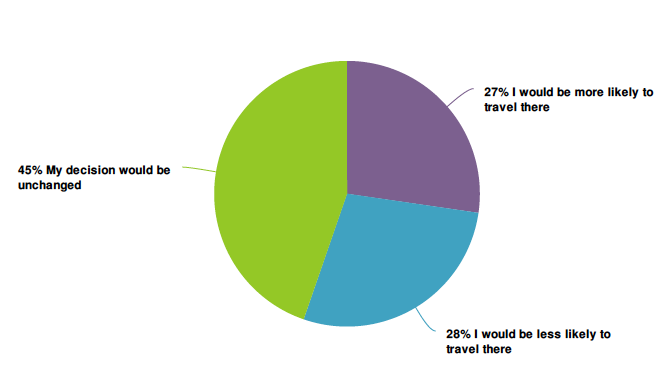
- Observation: Nearly half of respondents say they are unaffected by mask ordinances, and nearly equal amount of respondents were either more likely or less likely to travel to a destination because of an ordinance.
- Opportunity: It is important that your property take a stand on this issue, and follow through. Being clear in your expectations of guests’ behavior than being wishy-washy. This data shows that regardless of which stand you take, you will have equal number of people who are happy about that stance vs. unhappy. Having no clear policy leaves a lot of room for ALL guests to be unhappy upon arrival, being annoyed with other guests’ behavior.
This is the question we used to break down many other questions. You will see “Mask Preference” in the comments of other questions, and the labels “prefer mask” or “prefer no mask” as the comment categories.
2. Is the reported increase in COVID-19 cases going to impact your vacation plans
for 2020?

Want Masks

Do Not Want Masks
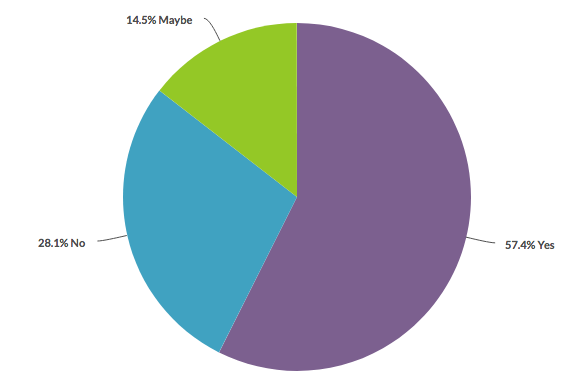
- Observation: 63% of people said yes.
- Mask Preference: 75% of those who prefer masks answered yes, vs. 57% who prefer no masks, and 58% of those are unaffected by masks.
3. What is the first word that you think of when considering travel right now?
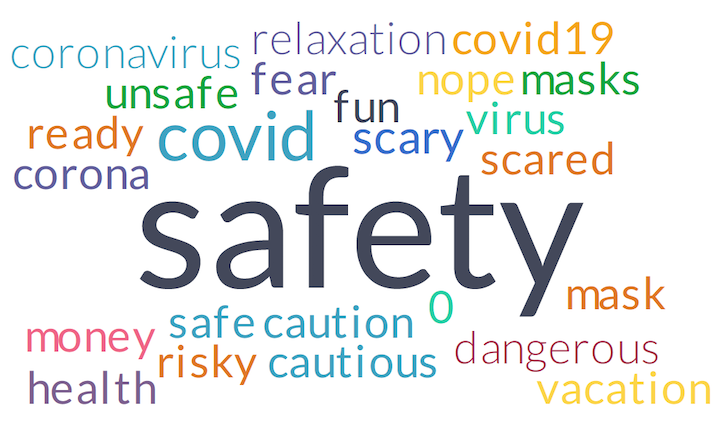
- Observation: “Safety” remains the most popular word.
- Data Comparison: “Mask” and “masks” have mad their first appearance. “Scary,” “risky” and “dangerous” remain at the same size we’ve seen through the last few surveys. “Nope” has returned. There is only one form of “relaxation” in this cloud. “Money” has made a third appearance, while “cost” and “price” have disappeared. “Ready” has returned, after a few versions without it, and “fun” remains again.
- Mask Preference: Those preferring masks mentioned “cleanliness” and “uncertainty.” Those who prefer no masks still chose “safety” as the top word. However, they also chose “freedom”, “excited,” and “restrictions.”
- Opportunity: People are concerned for their safety above all, but they are also craving relaxation and freedom from their houses. What can you do to ease their mind about traveling to your property, with their budget concerns in mind?
4. How will the coronavirus impact your likelihood of taking the following trips?
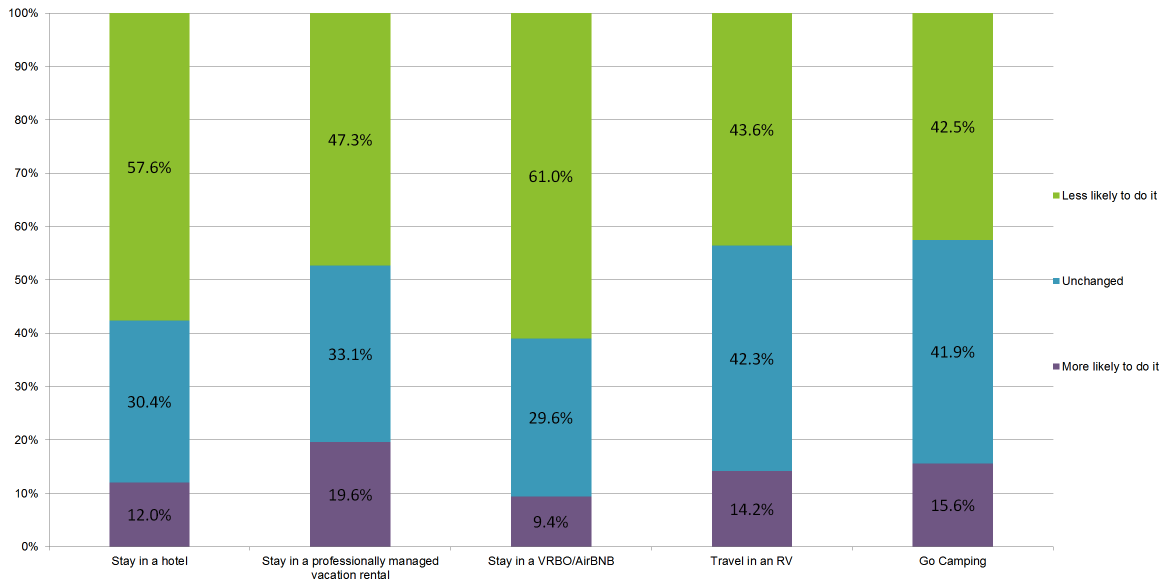
- Observation: All categories have been negatively affected by 40%-60%. Professional vacation rentals saw the largest positive change, with 20% of respondents saying they are more likely now to take that kind of trip.
- Mask Preference: Those who prefer masks had less unchanged responses than the group as a whole; their answers were more polarized. 65% are less likely to stay in a hotel and 68% less likely to use VRBO, but 28% said they are more likely to stay in a professional rental.
- Those who prefer to not wear masks had lower percentage of negative change. 52% said they are less likely to stay in a hotel.
5. Which of the following would most likely persuade you to book a future vacation during the coronavirus outbreak? (Check all that apply)

- Observation: 63% of people chose flexibility to change without penalty.
- Data Comparison: People saying that they could not be persuaded increased for the first time, going from 16% back up to 27%. Every other category decreased by several percentage points.
- Resource: Fuel put this article together on what types of policy changes and messaging you should be implementing right now: The Definitive Guide To COVID19 Policy Updates & Communication.
6. Have you already booked your future stay?
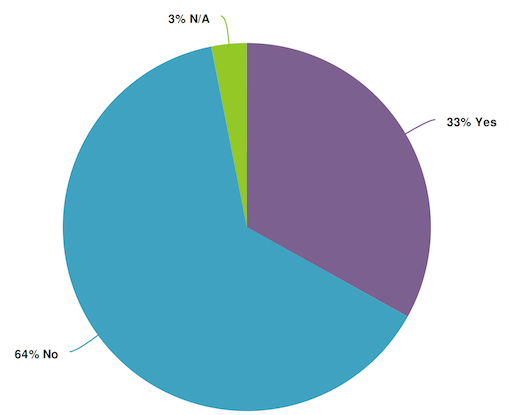
- Observation: 33% of people do have an upcoming stay booked, 64% do not.
- Data Comparison: These percentages have fluctuated with each survey, ranging from 60%-65% saying they do not.
7. Pick the top 3 reasons that would prevent you from staying at a hotel right now.
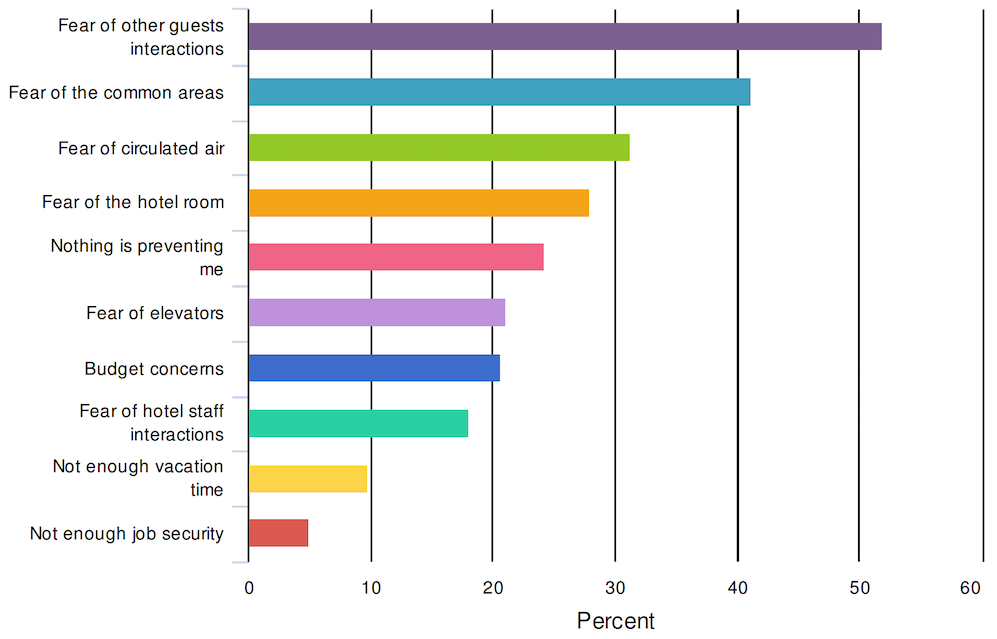
- Observation: The two most popular answers are pertaining to close contact of people on-property. 51% chose fear of other guests interactions, and 41% said fear of the common areas.
- Data Comparison: The results from this survey were much closer to volume 5, with the percentage of fear of guests and common areas increasing from 41% to 51% and 30% to 41%, respectively. The percentage of those saying nothing is preventing them from traveling now decreased from 33% to 24%. Budget concerns decreased from the #4 spot and 32%, to #7 and 21%.
- Mask Preference: Those who prefer masks had a 65% vote of fear of other guests vs. 43% of those who prefer no mask, and 48% of those who are unaffected by mask ordinances.
- Opportunity: Be clear with all of your messaging and website information as it pertains to the cleaning procedures on property. Additionally, communicating the status of property amenities, and area attractions and restaurants is extremely important. If your primary consumer is those with children, being mindful of their budget concerns will also be important.
8. During the outbreak, I would like to hear from hotels on the following topics: (check all that apply)

- Observation: Respondents continue to be more interested in learning about what properties are doing to protect guests than they are about receiving deals for future stays. In fact, those asking for packages and specials have decreased from 53% to 45%.
- Data Comparison: Those saying they would not like to hear from hotels now has increased for the first time, going from 18% to 26%! While those voting for what the property is doing to protect guests has decreased from 63% to 59%, how the virus is affecting the local area grew in percentage and rank again. It had started in 4th place and is now clearly in second, with 51%. Additionally, the property’s COVID plan also increased in rank, and is now 3rd.
- Mask Preference: An overwhelming 68% of people who prefer masks voted for what the property is doing to protect guests, vs. 49% of those who prefer no masks. Those who prefer no masks voted packages and deals as their top choice, at 51% vs. 42% of those who prefer masks.
- Opportunity: While desire to hear from hotels has declined, for those that DO want to hear from them, sending messaging with important information on their safety AND that provides value to them, and shows empathy, can keep your property top of mind.
- Resource: Having the right CRM system is critical to this success. Find out how to determine if you are ready for a new one, and for the best strategies for using your system to its fullest ability. Your CRM System Will Determine How (and if) Your Hotel Recovers From COVID-19
9. How likely are you to book a trip:
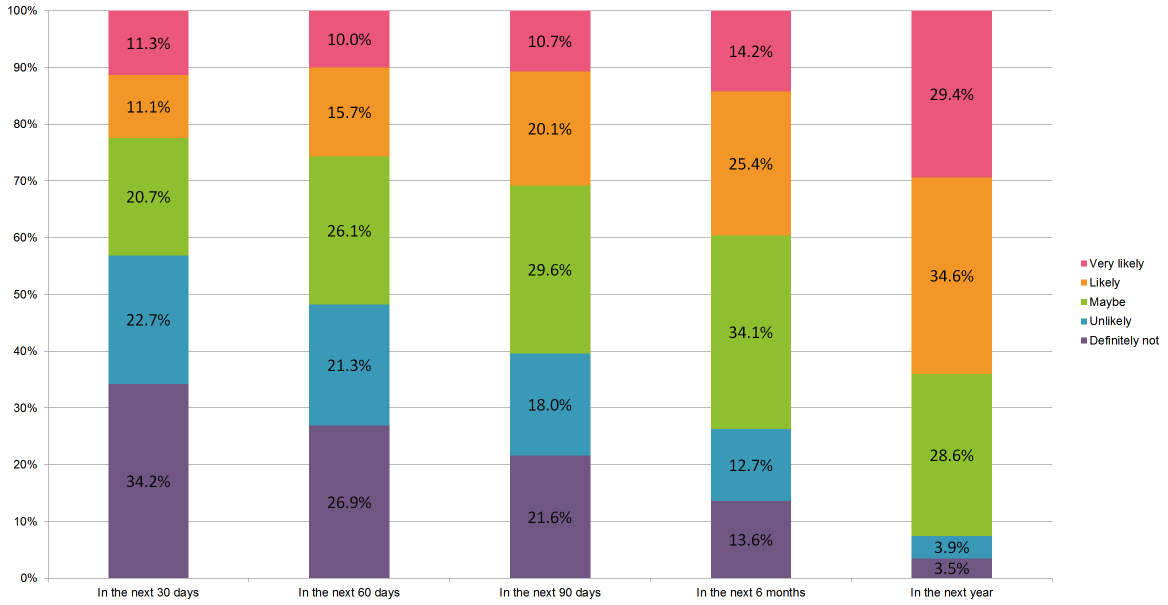
- Observation: 43% of respondents answered “maybe” or higher within the next 30 days. 52% responded for the next 60 days, and 60% for 90 days.
- Mask Preference: Those who prefer no masks had higher percentages in the more positive categories, and smaller percentages in the negative categories than those who prefer masks.
- Data Comparison: This is the first time we have seen a decrease in those answering at least “maybe” in the next 30 days, going from from 57% to 43%. When we first asked this question on April 16, 37% responded at least maybe.
10. How soon will you be willing to make the following trips?

- Observation: For distances of driving up to 2 hours, 51% of consumers will be ready to travel within 3 months, with 28% willing to travel within 1 month. Staying local was at 31% within 3 months, driving up to 6 hours was at 36%, and flying comprised just 12%.
- Mask Preference: 34% of those who prefer no masks responded they will be willing to travel up to 2 hours within 1 month, vs. 24% of those who do prefer masks.
- Data Comparison: Within 1 month, the following were notable changes:
- The 2 hour drive category decreased from 32% to 28%. It had previously been as high as 34%.
- Staying local decreased from 20% to 14%.
- Up to 6 hours decreased from 22% to 18%
- Across all categories, 0-6 months saw declines and 6 months to more than a year saw increases.
- Opportunity: The 2 hour drive market remains the most confident for traveling sooner rather than later. For the near future, targeting these consumers via email and paid search will yield the best returns.
- Resource: Fuel has developed A How-To Guide For Targeting Drive Markets
11. How soon will you be willing to travel to the following types of destination?
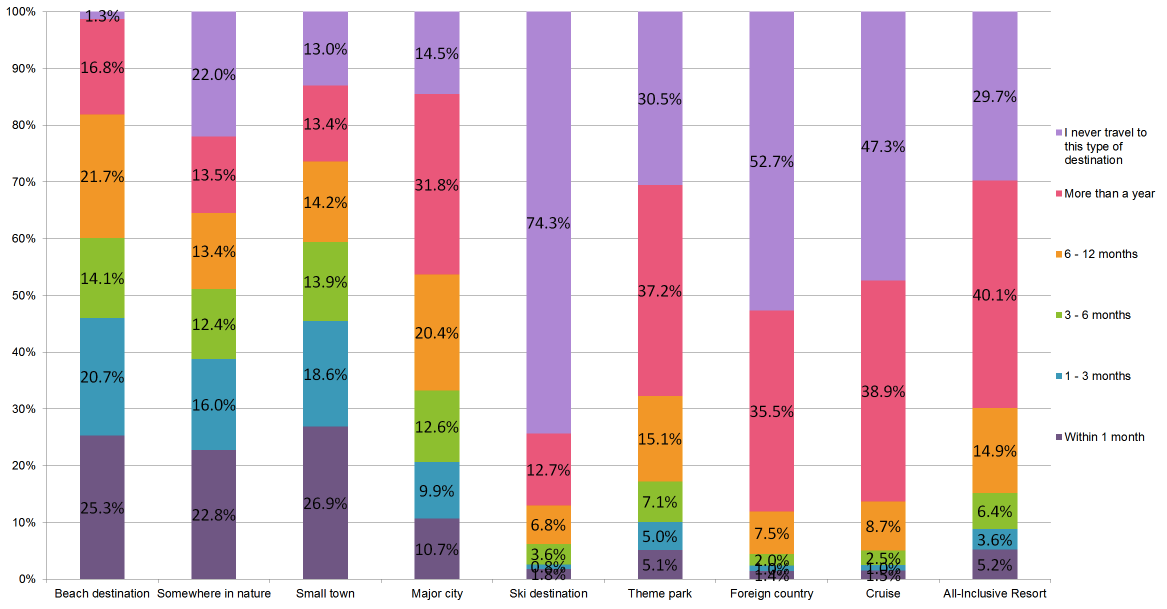
- Observation: Destinations with opens spaces continue to far more likely to be visited earlier than densely populated areas, or high-touch destinations.
- Mask Preference: Those people preferring no mask had 29% of respondents vote to travel to a beach destination within 1 month vs. 20% of those who would prefer a mask. Even the major city category saw a discernible difference, at 15% vs. 6% for no masks vs. masks preferred within 1 month.
- Data comparison: All open space categories saw decreases in 0-3 months, and significant increases in 6 months to more than a year. Beach destination within 1 month decreased from 31% to 25%, and more than a year increased from 9% to 17%.
11. For your next vacation, what level of house keeping would you prefer?
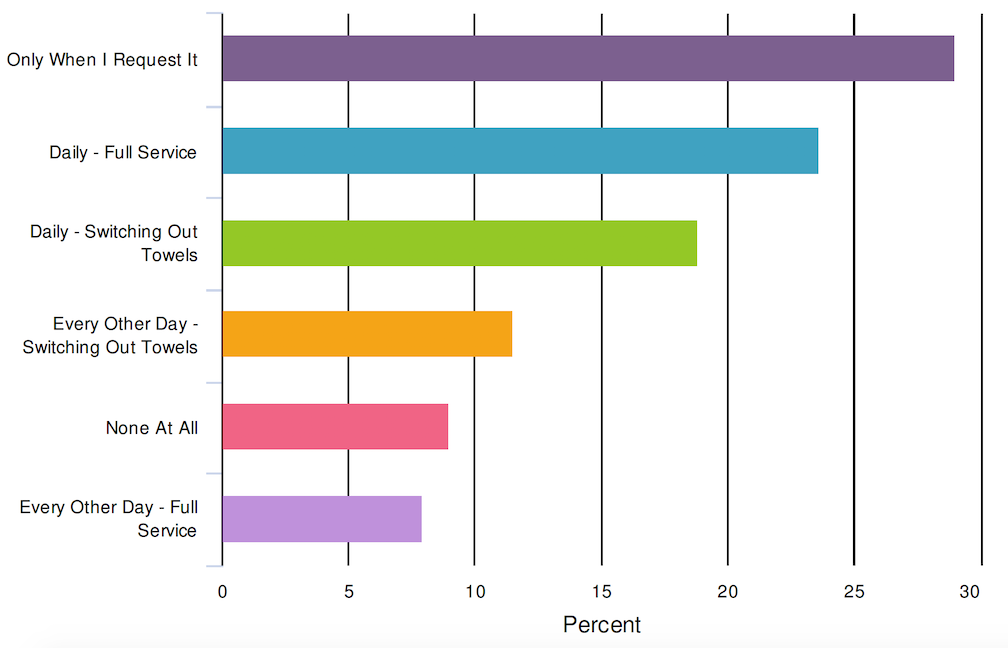
- Observation: Responses continue to be quite diverse, however, the most popular response is still “only when requested,” at 29%. 24% still want daily, full service, and another 19% would like daily towel changes.
- Data Comparison: Daily full service came back into the #2 spot, several percentage points above daily switching of towels.
- Mask Preference: Those who prefer masks voted 31% “only when requested” vs. 27% of those who prefer no masks.
- Opportunity: If you haven’t already, this is time to re-think housekeeping procedures entirely. Will you cut down to “by request only?” Will daily housekeeping be an up-charge?
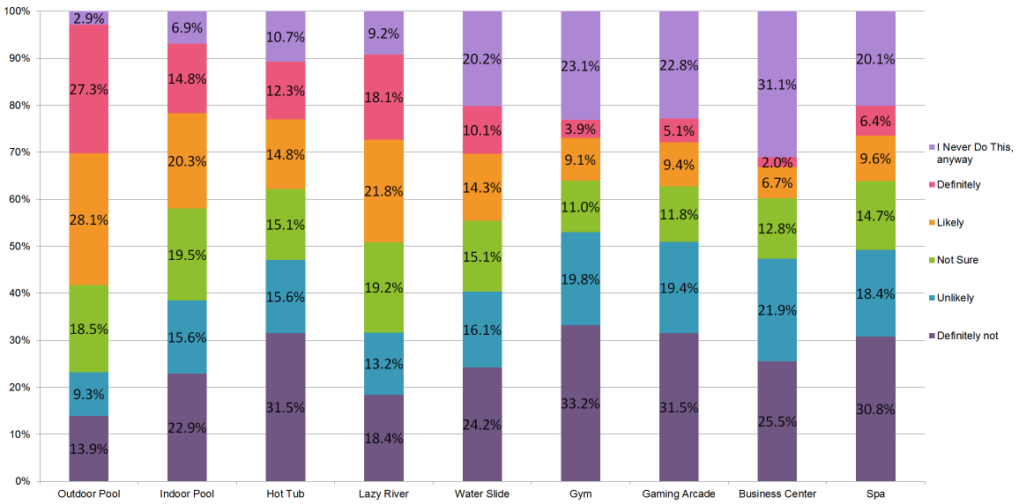
12. During your next vacation, how likely are you to use the following amenities?
This Survey
Mask Preference

This Survey vs. Last
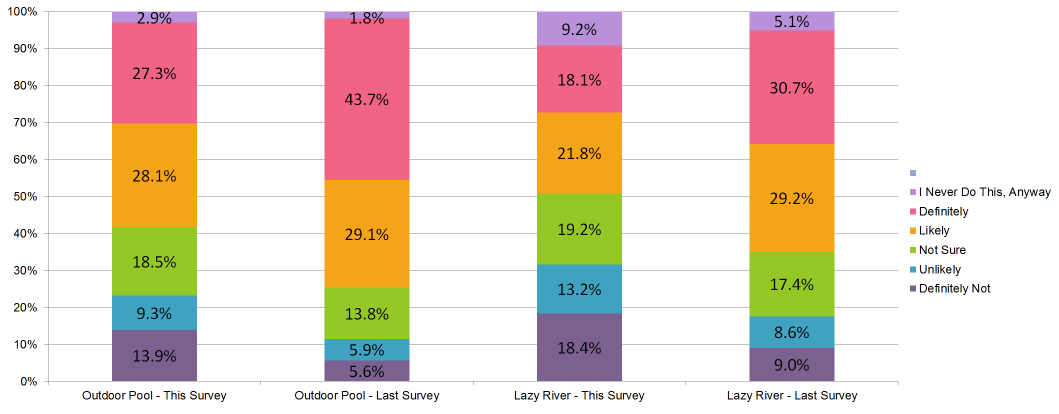
- Observation: In this version of the survey, those answering Definitely to outdoor and indoor pool was much closer, with 27% saying yes to the outdoor pool and 15% to indoor.
- Data Comparison: All of these numbers have shifted greatly since the last survey. Those definitely using an outdoor pool decreased from 44% to 27%! Those who said definitely not, increased from 2% to 14%!
- Mask Preference: Those who prefer masks were less likely to choose “Definitely” across all amenities. Outdoor pool was just 19%. Those who prefer no masks voted 36% to definitely use the outdoor pool, and all other amenities were voted higher than the group as a whole.
- Opportunity: Clearly explaining health safety procedures for all amenities is important, so that guests will know what to expect when they arrive. This is particularly true if it means restrictions on how many people can be present, or if masks are required, etc.
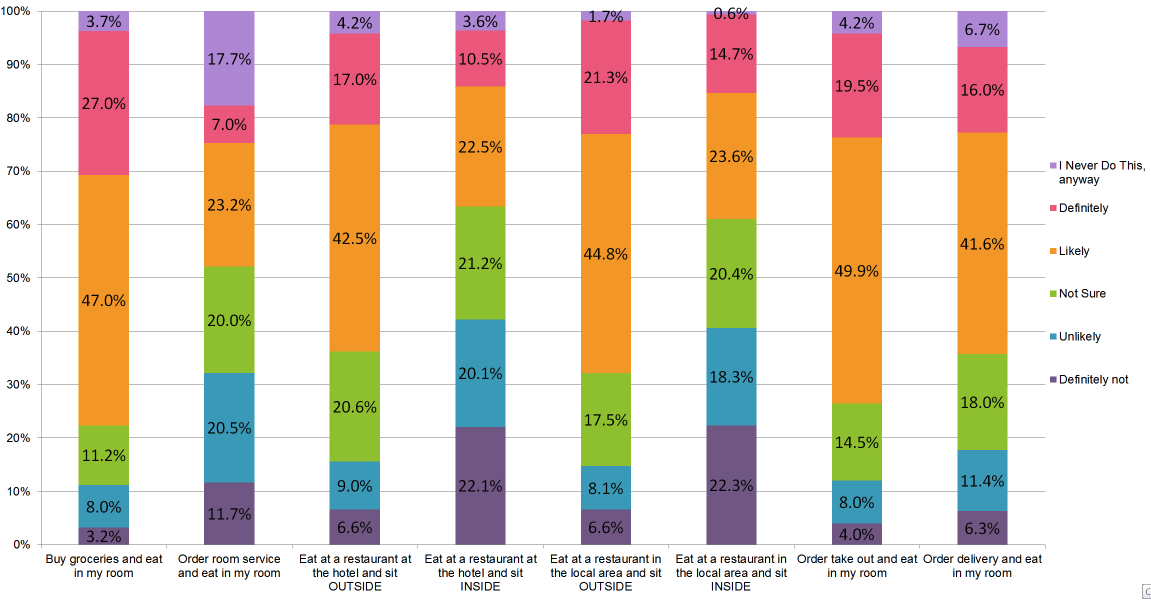
13. During your next vacation how likely are you to do the following?
This Survey
Mask Preference
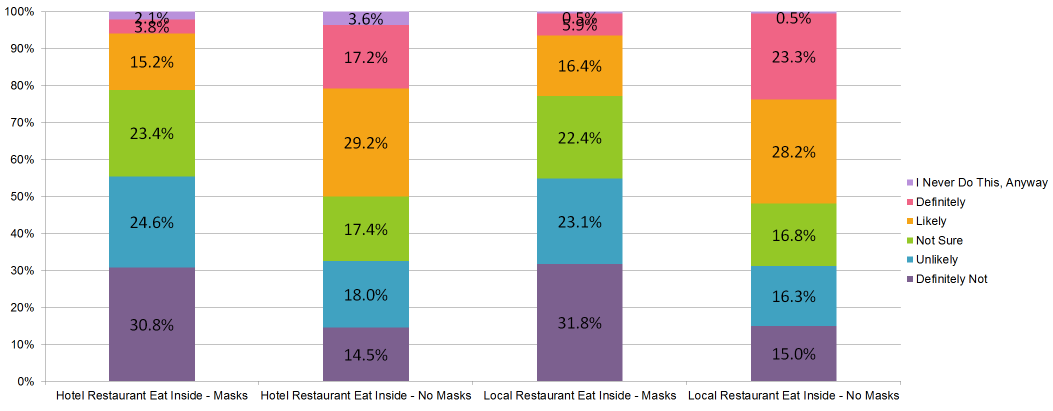
This Survey vs. Last

- Observation: Respondents voted that eating on property and at local restaurants OUTSIDE was far more favorable to eating at those places inside. 60% said they were likely or definitely eating outside on-property, vs. 33% inside; 66% for outside at a restaurant, vs. 38% inside.
- Data Comparison: We saw big decreases in those saying likely or definitely for indoor options: on-property restaurant decreased from 45% to 33%; local restaurant decreased from to 54% to 38%. These are the lowest percentages we’ve seen since we started asking this question. Buying groceries for the room continues to increase in popularity.
- Opportunity: If you have an on-property restaurant, promoting outdoor seating will be a large benefit. Additionally, with consumers being even more likely to buy groceries to eat in their rooms, properties that have rooms with kitchens have a huge advantage. Showcasing those kitchens is imperative now.
14. Complete the following sentence: I will travel when:
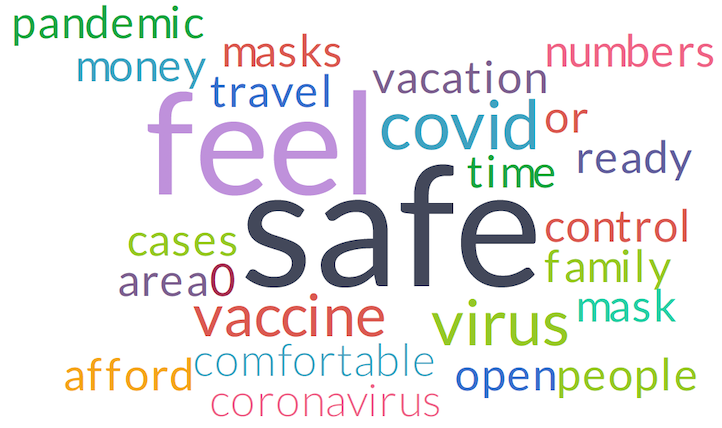
- Observation: “Feel safe” is most prevalent since we first asked this question. Phrases relating to a vaccine, number of virus cases declining have also been popular.
- Data Comparison: “Mask” and “masks” have made their first appearances in this cloud, as well. “Money” and “afford” are back again. Finances may be becoming more of an issue, the longer people continue to be out of work. “Area” and “open” would indicate that consumers want to be assured that the surrounding area to the hotel will be open (restaurants, attractions, etc.).
- Opportunity: As mentioned before, whatever you can do to assure visitors that you have their well-being as a priority will increase your chance in convincing them to stay with you. Being cognizant of the financial stress many people are feeling, and providing value-add items to packages where possible will help consumers feel more comfortable booking.
Wrapping it Up
We have now been sending out these surveys for over 3 months. In this time, respondents have been consistently sending the same message: they care about their health safety.
The level of comfort in traveling has shifted again, and there is clearly more fear or uncertainty now. As the pandemic continues to change on a weekly basis, we would continue to expect more changes in sentiment. Properties need to be doing all they can to let potential guests know that they are looking out for everyone’s safety, as well as communicating information about the surrounding area.
Survey Methodology
This was a self-reporting survey sent to a database of leisure travelers located in North America. Questions containing multiple checkbox responses had the options randomized to avoid positional bias. 4,000 respondents completed all questions.
Below is the demographic breakdown of respondents.
Age & Gender:


Do you have children living at home with you?

What was your total estimated household income before taxes during the past
12 months?
