
Has the Leisure Hotel Market Turned the COVID-19 Recovery Corner?
by Melissa Kavanagh
We have been very closely monitoring our client data in conjunction with data and trends released from other industry experts to see how our clients compare, and gain any insight for recovery and marketing strategies. In this analysis, we are using China’s recovery as a guide.
China Data

Here are the facts we know about China:
- Reported Covid cases peaked mid-Feb
- Occupancy hit bottom of 10% at week ending 2/8
- Substantial recovery started 2/22 (2 weeks from bottom)
China leisure occupancy hits above 10% (2 out of 4 cities) week ending 3/5 (3 weeks from bottom). 
I have recreated this STR slide so I could add a trend line (the thick red one).
Based on this, China’s leisure market is overall at about 22%, and it’s taken 2 months from when the overall China market hit bottom to get here. 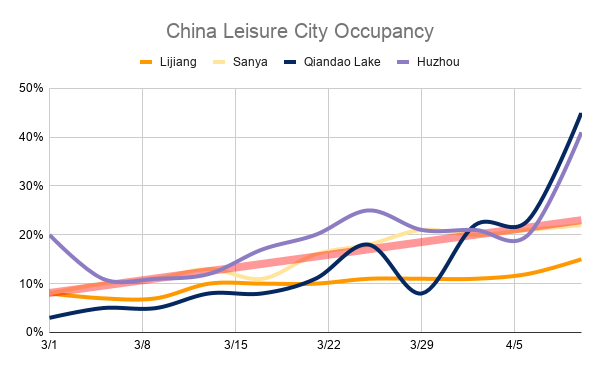
Data from United States
Below is some pertinent data collected regarding the U.S.:
- U.S. cases peaked 4/10
- NC and SC cases peaked 4/7-4/11
- U.S. occupancy hit bottom of 20% occupancy a few weeks ago.
- We are still at 20% as of 4/11, about 3 weeks since we saw the bottom hit.
- We are behind China in terms of seeing an increase in occupancy, but ahead in overall occupancy at this point vs. China. Europe is stagnant as well.
- At a high level, we are about 2 months behind China. But our bottom is lasting longer than theirs.
Our takeaway from all of this is that once we DO start seeing an uptick in occupancy, we should expect a slow increase week to week, of about 5%.
The data below shows that it’s possible that we’ve started that very slow recovery in the last week.

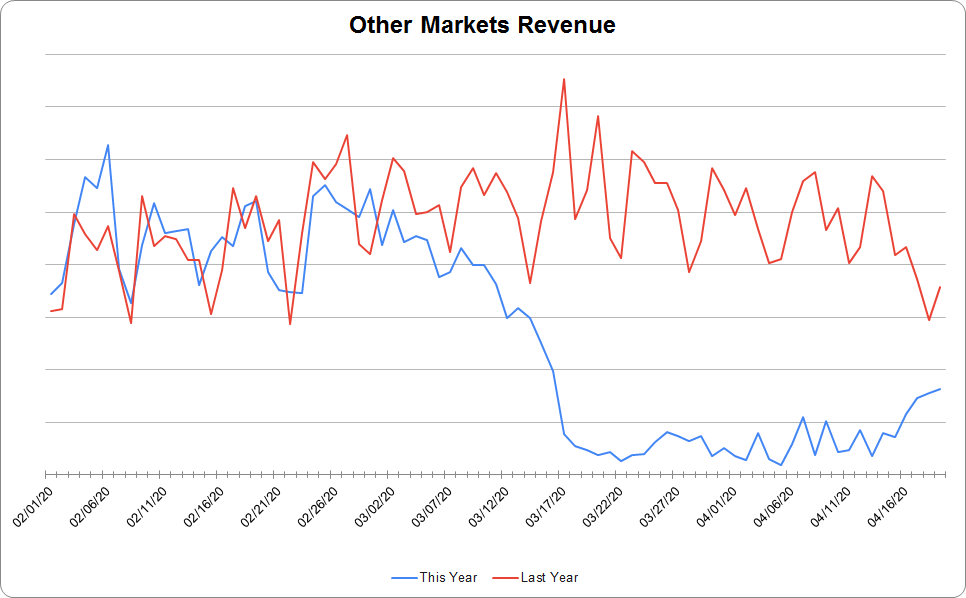
If this is the start of recovery, using China as a guide, we could still be at 50% less occupancy than usual by mid-June. That said, those in summer destination markets happen to be positioned to be the start of peak vacation period at that point, and it’s possible that we could get lucky with occupancy picking up at a faster pace at that time. Since we don’t have further data from the Chinese leisure market past the 2 month point, we don’t even have a guide as to what that rate could be. There are still a lot of unknowns, so this is truly just a hypothesis.
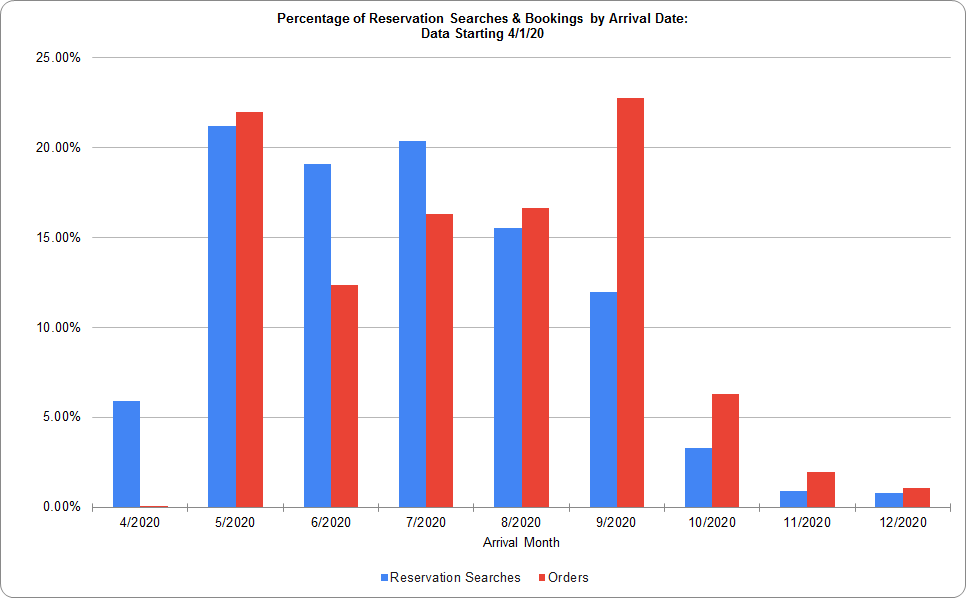
We’ve collected client data that shows what time frames website visitors are searching and booking. This data collection is beginning on April 1, 2020.
You can see that as of the writing of this post, while May is the most searched, September has been the most booked. This tells us that consumers are feeling more confident booking sometime later in the year. This data is corroborated by the latest findings in our Consumer Travel Sentiment Study.
What Now?
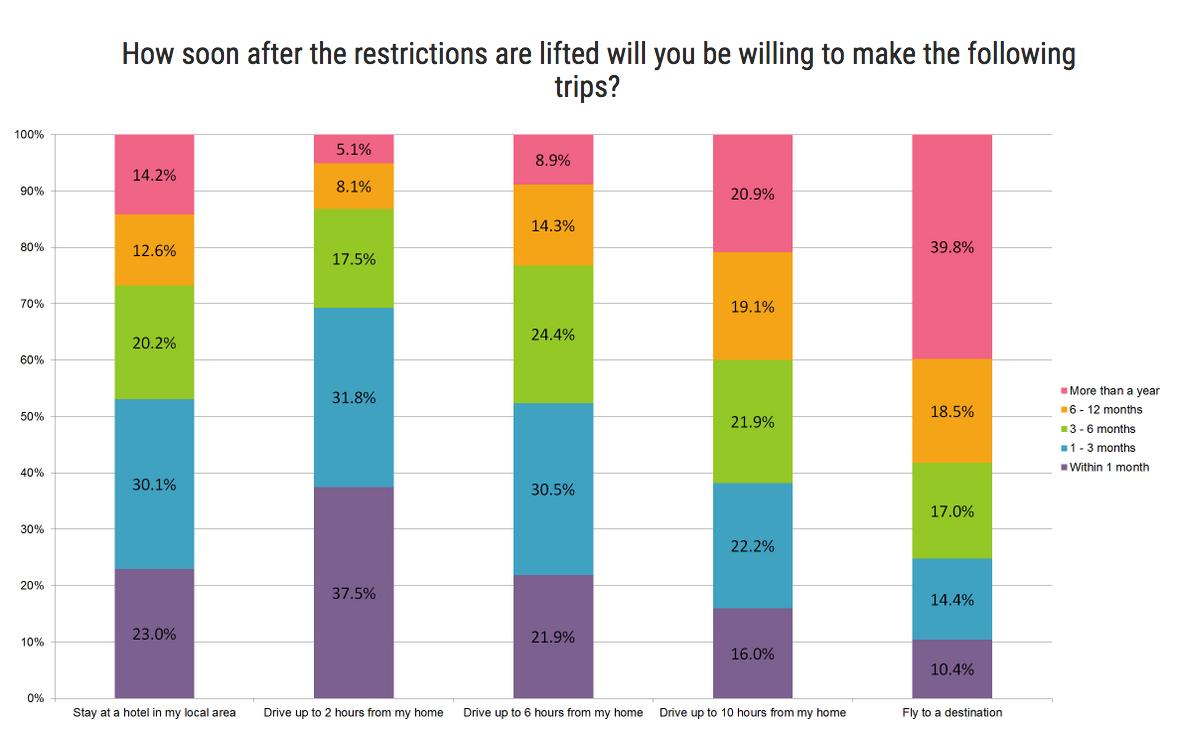
As found in the second edition of the TravelBoom Consumer Travel Sentiment Study, the drive market is much more inclined to begin traveling first. This should be top of mind as you examine your marketing efforts.
Now is the time to be ramping up (or restarting) marketing efforts.
Take a look at these resources for some inspiration:
- Crisis Recovery Checklist for Hotels
- Surefire Strategies To Recover Your Hotel’s Lost Reservations
- How To Adjust Your Advertising Strategy Right Now
We are all in this together. If there is anything we can help you with, please contact us. And don’t forget our master list of crisis resources!