December 31, 2020 · Melissa Kavanagh
Fuel COVID-19 Consumer Sentiment Study Volume 11: Will a Vaccine Bring Back Leisure Travel?
This is the 11th edition of Fuel’s COVID-19 Consumer Sentiment Study. As the virus continues to impact the state of travel and the hospitality industry, we want to continue to provide insights on the sentiment of consumers. This version of the survey was timed so that we could ask about both Thanksgiving travel behavior that took place, and upcoming travel plans for the remainder of the holiday season. We also asked many questions to find out how a vaccine will impact travel planning for 2021. If you want to listen to the Fueligans analyze the data check out our podcast on this study.
We hope that you find the information useful. The survey was sent out on December 17, 2020, and received 2,100 responses. Below is a summary of the findings, along with some observations and opportunities.
Executive Summary
We’re continuing to see shifts back and forth of consumer confidence to travel. In this round we did see a smaller percentage of people willing to travel in the immediate future than in the last survey. We asked many questions about how a vaccine will impact the decision to travel. A few key points are below:
- More than half of the respondents have traveled since the pandemic, and most have traveled more than once. However, most did not travel for Thanksgiving and had no plans for the rest of the holiday season.
- Most people plan to get a coronavirus vaccination
- 60-70% of people said that some form of the vaccination being administered would improve the likelihood of booking a vacation in the next 6 months
- Most people expect to spend the same or more on vacations in 2021
- The 1-3 hour drive market continues to be the most popular
1. What is the first word that you think of when considering travel right now?
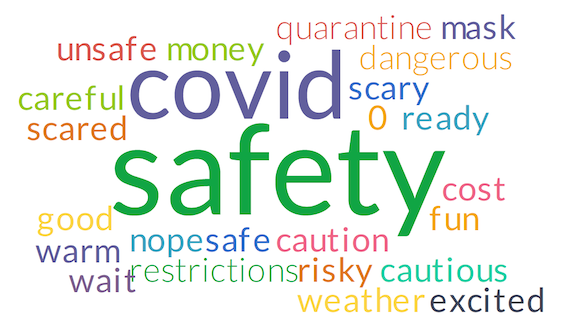
- Observation: “Safety” remains the most popular word.
- Data Comparison: “Mask” and “masks” continue to appear here. “Fun” has returned again, and we are now also seeing “excited” and “good. ” That said, “unsafe” has returned, and we still see “risky,” “scared,” “dangerous,” and “cautious.”
- Opportunity: People are concerned for their safety above all, but many are wanting to experience some respite from being home for so long. What can you do to ease their mind about traveling to your property, with their safety concerns in mind?
2. Have you traveled since March 15th, 2020?
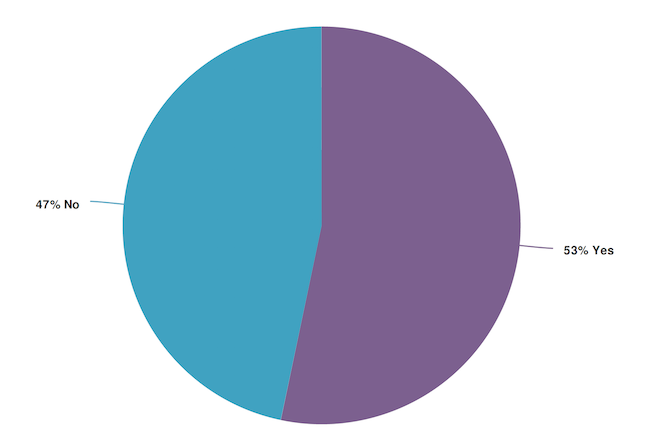
- Observation: 53% of respondents have traveled since COVID-19 was declared a pandemic.
- Data Comparison: This data is, surprisingly, unchanged since our last survey, which was completed before Thanksgiving.
- Age Comparison: 65% of those under 40 have traveled, vs. 52% over 40.
- Income Comparison: 51% of those in the <$50K income group responded yes, compared to 56% in the $50-100K group, and 59% for those in the >$100K group.
3. How many trips have you taken since March 15th 2020?
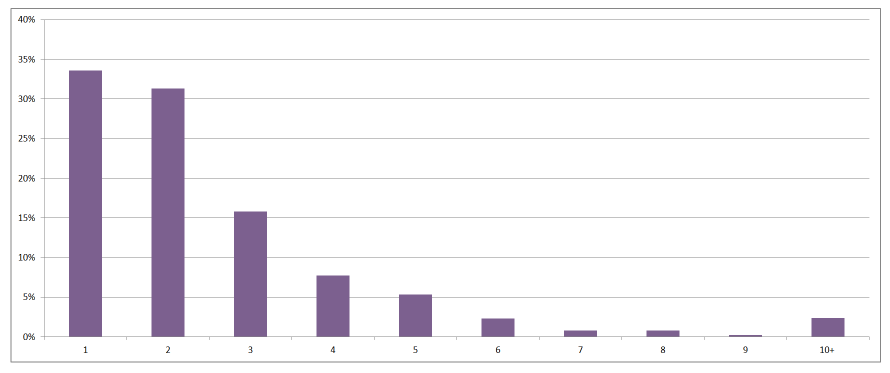
- Observation: While traveling once was the most popular response, it only made up 34%, making the majority of respondents traveling at least two times.
- Data Comparison: While the percentage of people who traveled during the pandemic is unchanged, the percentage of people who have made multiple trips increased from 56% to 66%.
- Opportunity: With nearly 70% of people saying that they have traveled at least twice since the pandemic, what can you do to get your guests to come back again?
- Resource: BE the hunter hotelier: The Hunter Hotelier: Driving Their Own Demand & Succeeding In Today’s Market
4. Did you travel over the Thanksgiving holiday?
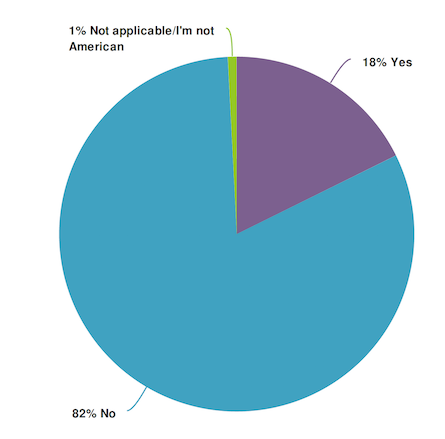
- Observation: A resounding 82% said they did not travel for Thanksgiving this year. There was no difference in responses by age.
5. Do you plan to travel during the upcoming holiday season?
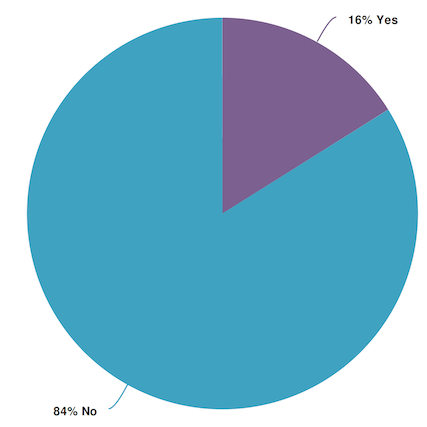
- Observation: Similar to Thanksgiving, 84% of respondents said they would not be traveling over the holidays this year.
6. Do you plan to get a coronavirus vaccination?
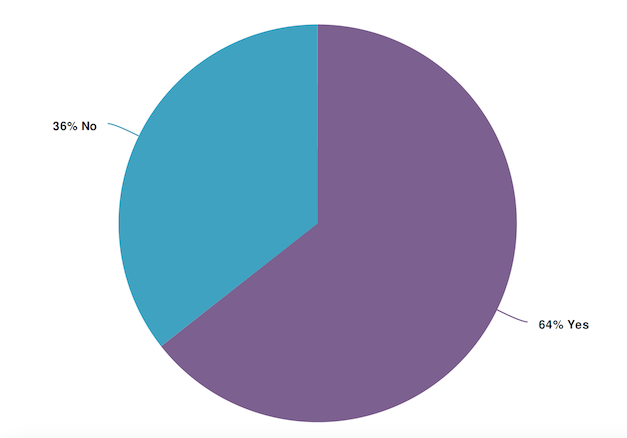
- Observation: More than 60% of people said they are planning on getting vaccinated.
- Age comparison: 51% of those under 40 said yes, vs. 65% over 40.
- Income comparison: 55% of those in the <$50K income group responded yes, compared to 65% in the $50-100K group, and 71% for those in the >$100K group.
7. In 2021, assuming cases are dropping and vaccines are beingdistributed, when will you likely BEGIN PLANNING your next trip?
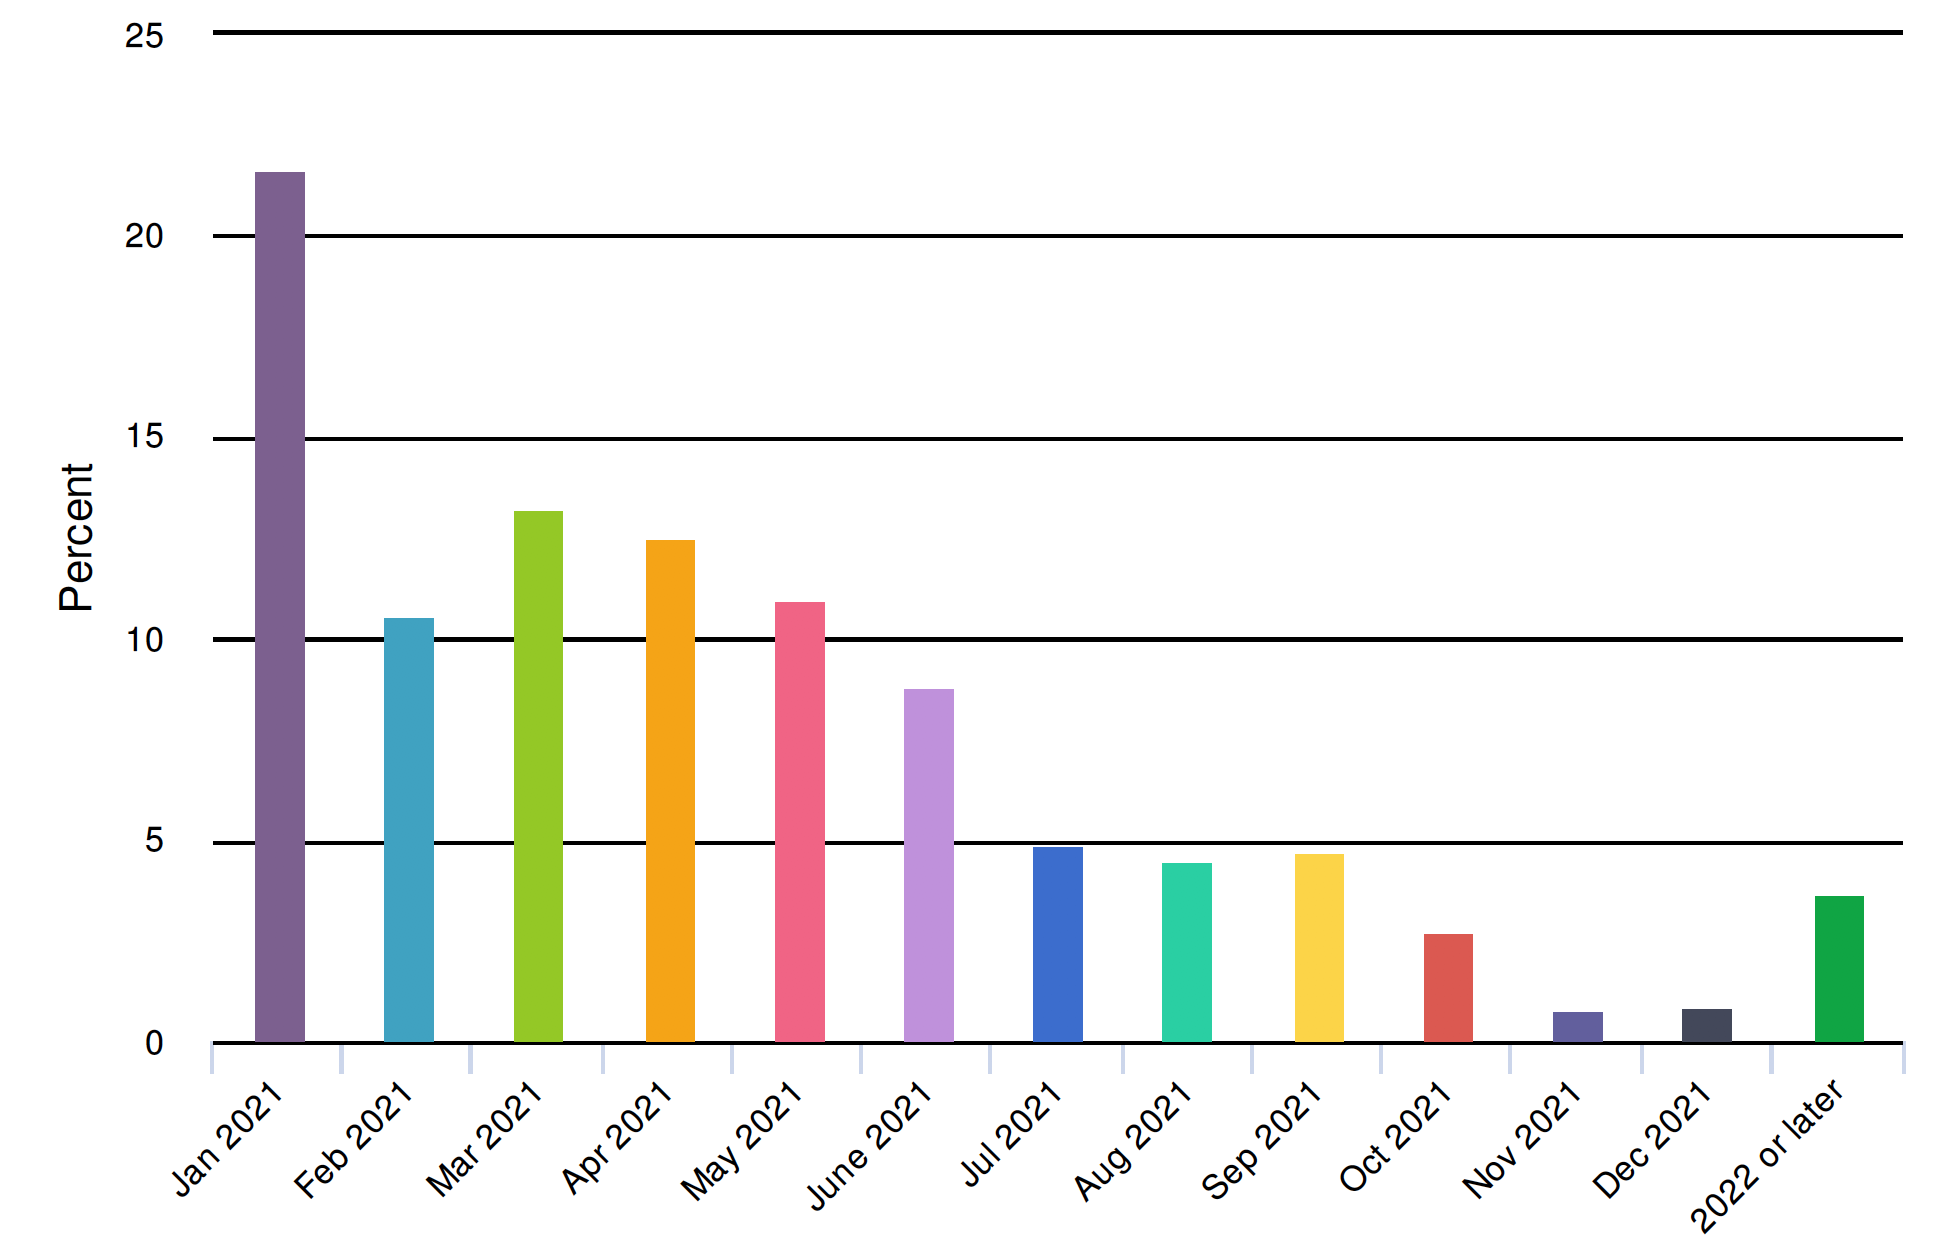
- Observation: More than 20% of people said they would start planning a trip in January, and 45% saying they would be planning in the first quarter of 2021.
- Opportunity: Now is the time to be getting your brand in front of potential guests.
- Resources: A few articles to get you started on messaging your potential guests:
8. In 2021, assuming cases are dropping and vaccines are beingdistributed, when will you likely BOOK your next trip?
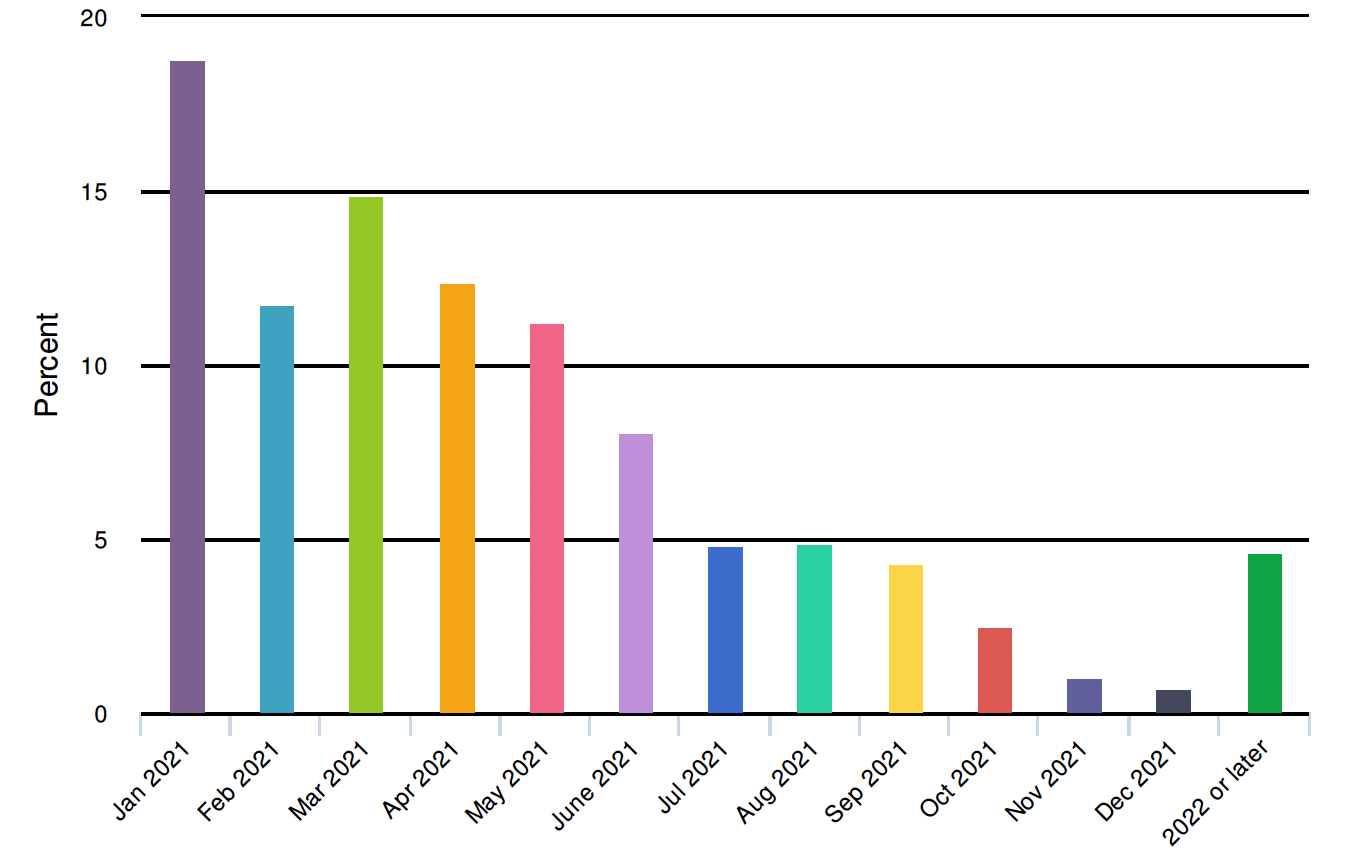
- Observation: 45% of respondents said they would be ready to book a trip in the first quarter of 2021.
9. In 2021, assuming cases are dropping and vaccines are beingdistributed, when will you likely TRAVEL for your next trip?
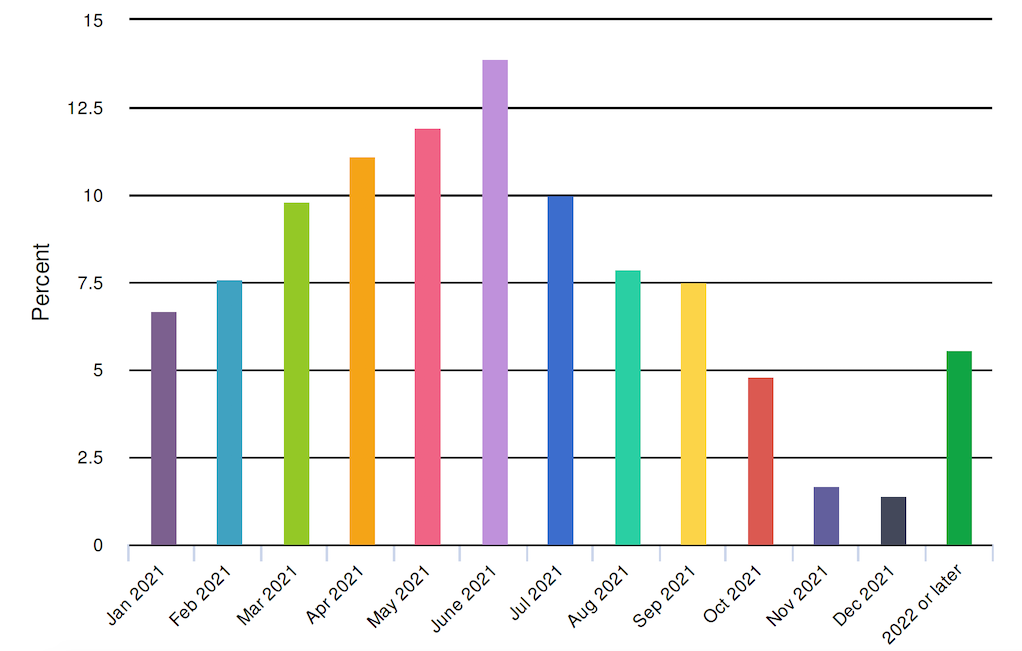
- Observation: Not surprisingly, the spring and early summer months of April-July were most popular, accounting for 47% of votes.
10. In 2021, do you expect your travel budget to increase, decrease, orremain the same as it was in 2019?
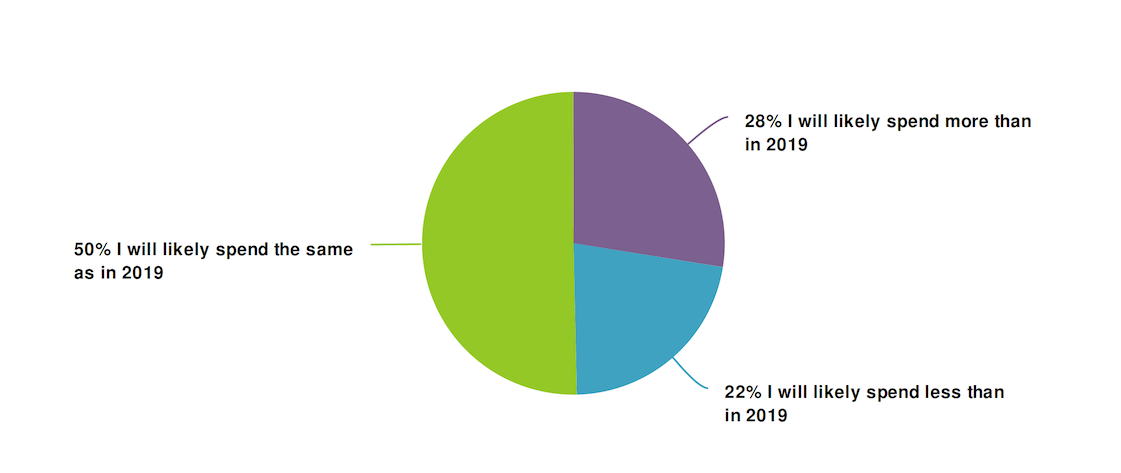
- Observation: 50% of people said they would have no change in spending vs. 2019. Only 22% said they would spend less. There were no significant differences by age.
- Income Comparison: There was little difference by income group for those responding that their spending will not change. However, 29% of the <$50 group said they would spend less, vs. 22% of the $50-100K group and 16% of the >$100K group.
- Data Comparison: When we first asked this question in March about upcoming travel budgets, 60% said their budgets would be unchanged, and 38% said they would be spending less.
11. In 2021, do you expect to take more, fewer, or the same number oftrips than you took in 2019?
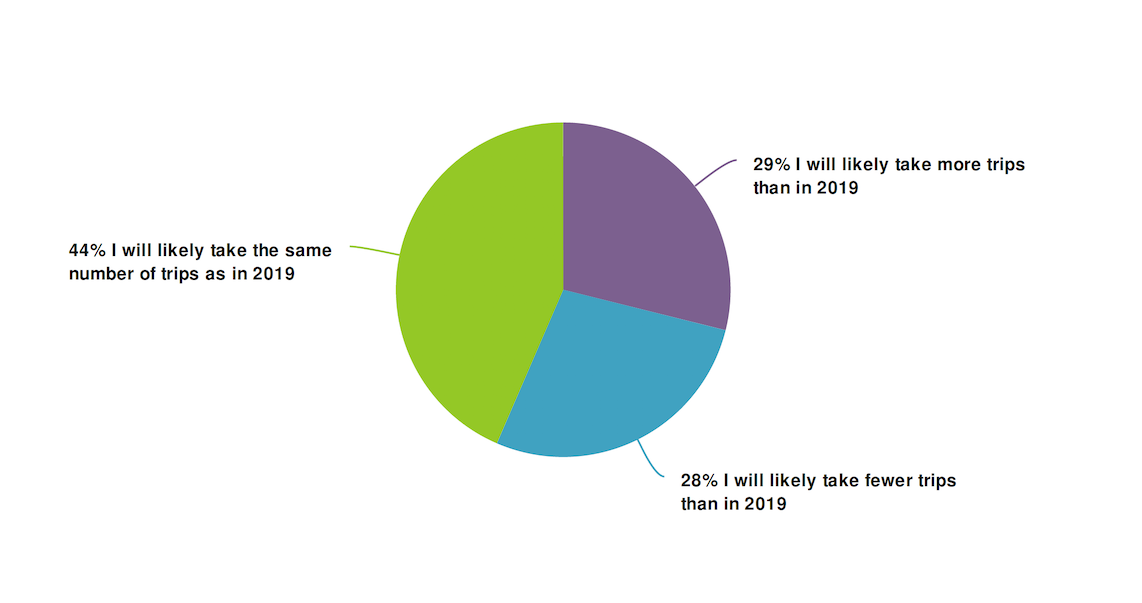
- Observation: 44% of respondents said their travel frequency would be unchanged. There were equal numbers of people who said they are likely to take more trips next year, as those who said they would take fewer trips.
12. In 2021, do you expect to take more, fewer, or the same number oftotal vacation days than you took in 2019?
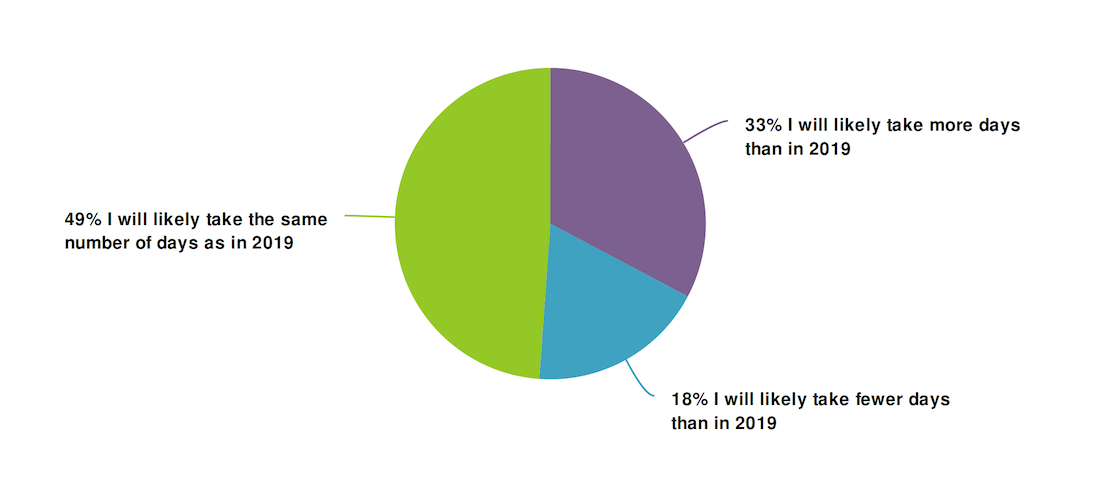
- Observation: About 50% said they will take the same amount of vacation days as in 2019. However, 33% said they would take MORE vs. just 18% who said they would take less.
- Income Comparison: Those people in the <$50K group had a 28% response rate for taking more days, vs. 33% in the $50-100K group, and 40% in the >$100K group.
13. On a scale of 0 – 5, how will the following vaccination scenariosincrease your likelihood of booking a vacation within six months? (0 =No Impact, 5 = Dramatically Increase)
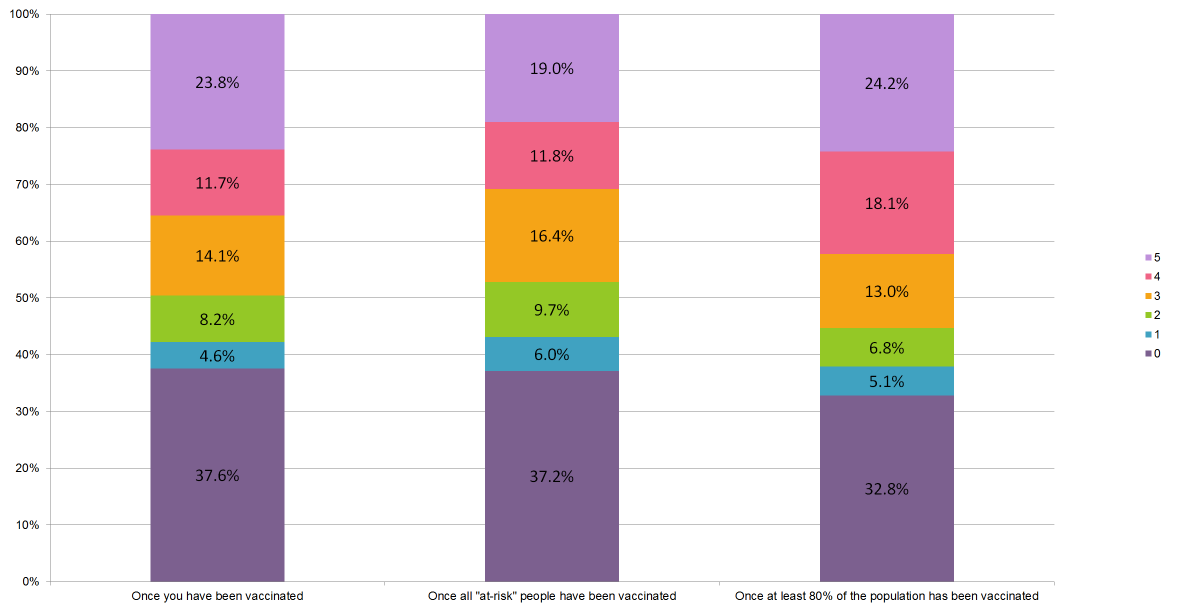
- Observation: More than 60% of respondents in all 3 categories said that a vaccine would increase their likelihood of booking a vacation.
- Age Comparison: 40%-49% of those under 40 said a vaccine would have no impact in their decision to take a vacation, compared to 32%-37% of those over 40.
14. Pick the top 3 reasons that would prevent you from staying at a hotel right now.
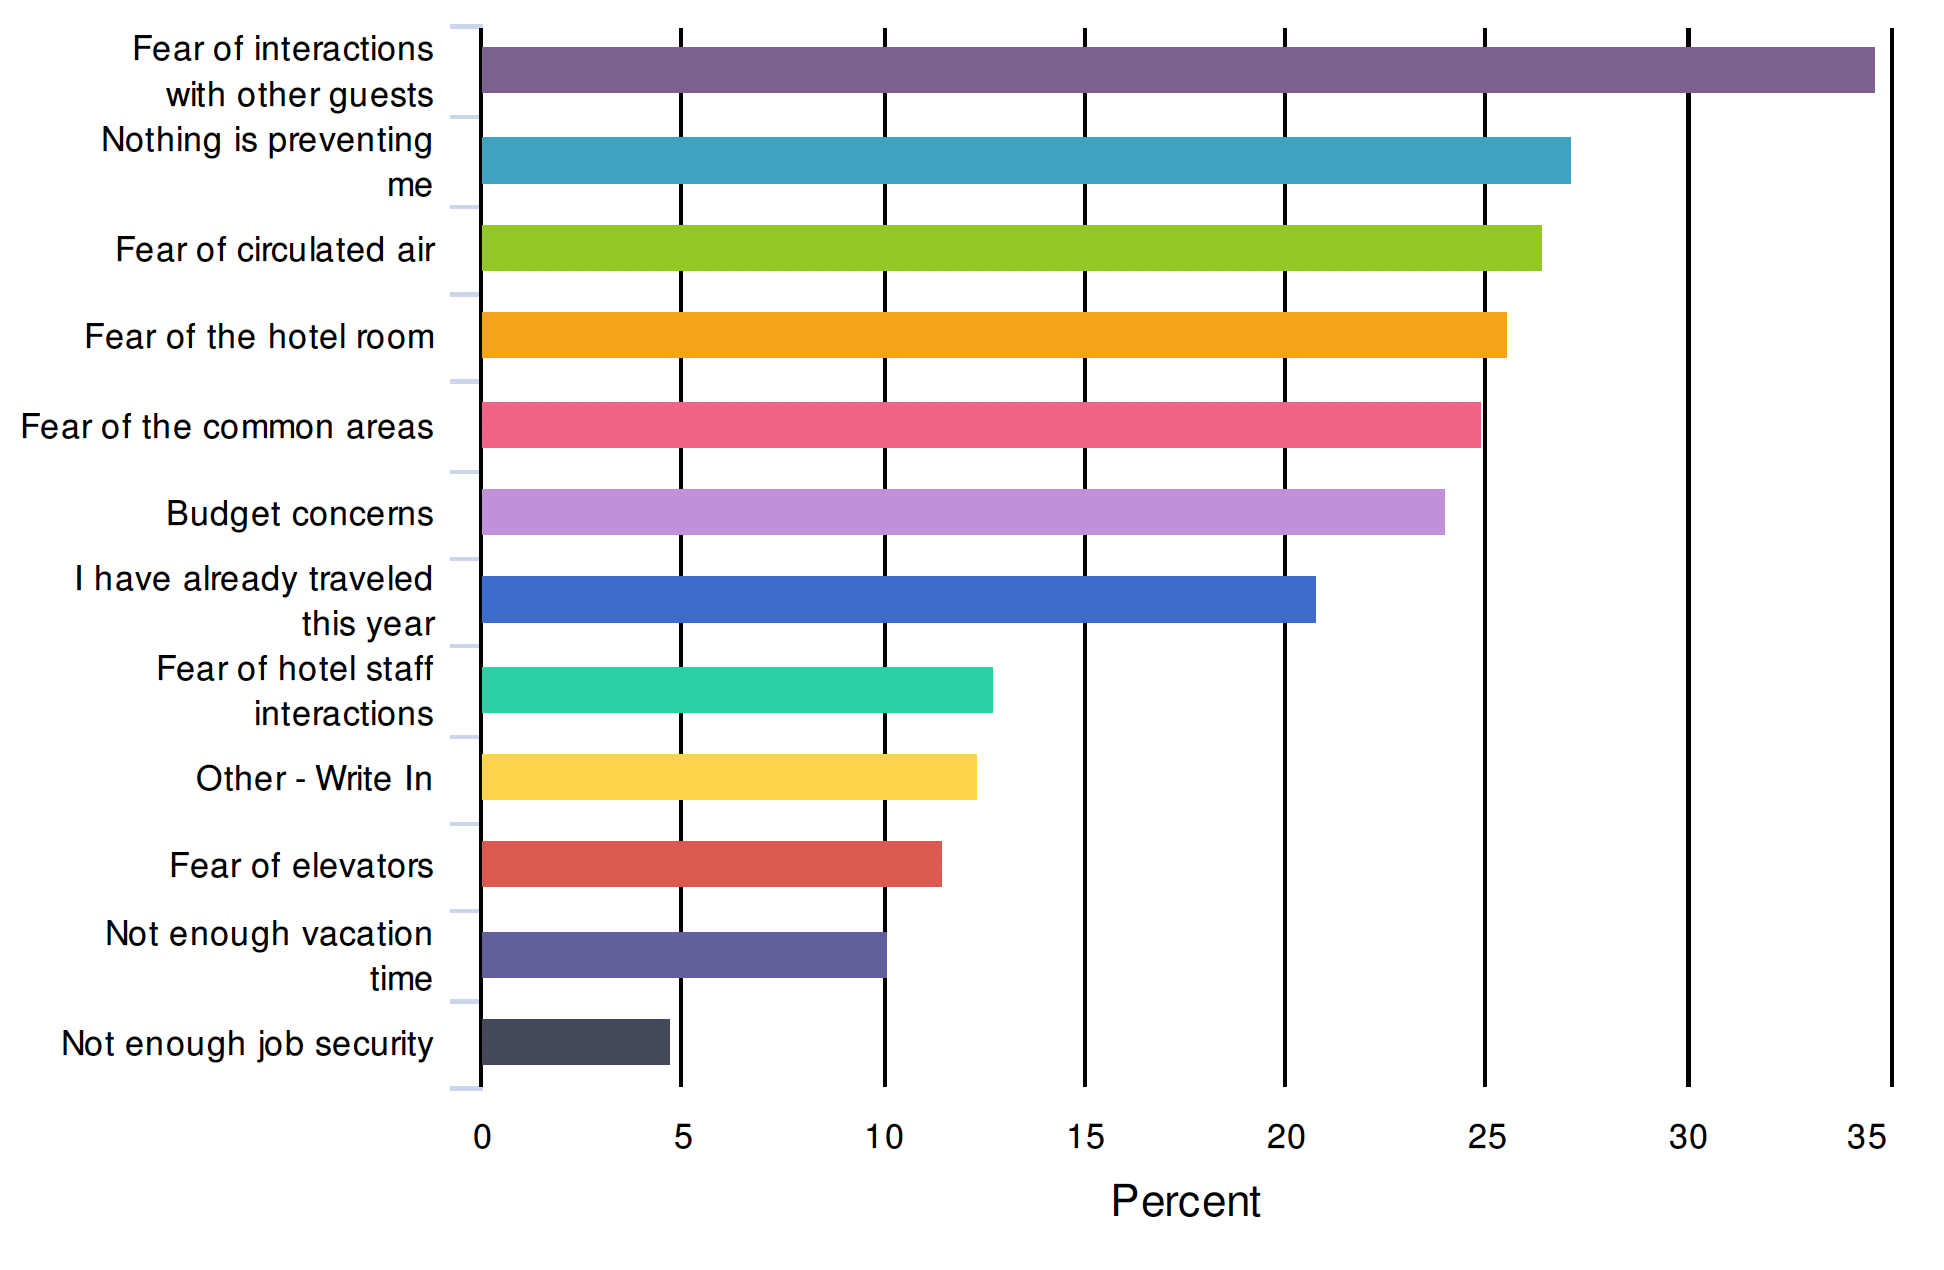
- Observation: Fear of other guests interactions remains the top concern, with nearly 35% of respondent votes.
- Data Comparison: “Nothing is preventing me” remained in the #2 position, with 27% of respondent votes. Fear of the common area remained in the #5 position, where it had previously been in the #2 position in earlier surveys.
- Age Comparison: Those under 40 voted fear of interactions with other guests at 36%, compared to 35% of those over 40. While the difference is very small, it is surprising that the younger group would vote for this more so than the older group.
- Not as surprising, budget concerns were #2 for the younger group, at 33%, 32% for those saying they already traveled. “Nothing is preventing me” came in #4 at 29% vs. #2, but 27% of votes from the older group.
- Income Comparison: Budget concerns were the top reason for those under $50K, with 40% of votes, vs. 24% for the $50-100K group, and 12% for the >$100K group.
- Opportunity: Be clear with all of your messaging and website information as it pertains to the cleaning procedures on property. Additionally, communicating the status of property amenities, and area attractions and restaurants is extremely important. If your primary consumer is those with children, being mindful of their budget concerns will also be important.
15. How likely are you to book a trip:
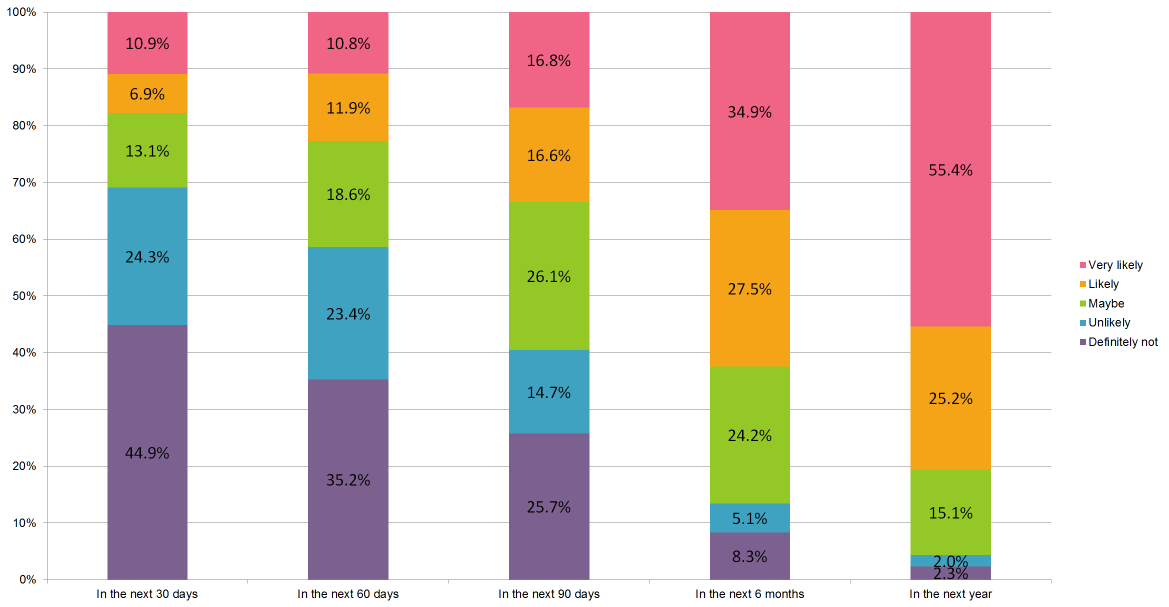
- Observation: 31% of respondents answered “maybe” or higher within the next 30 days. 41% responded for the next 60 days, and 60% for 90 days.
- Data Comparison: Those answering at least “maybe” in the next 30 days, decreased substantially from 55% during our last survey. This is now lower than when we first asked this question on April 16, and 37% responded at least maybe.
16. How soon will you be willing to make the following trips?
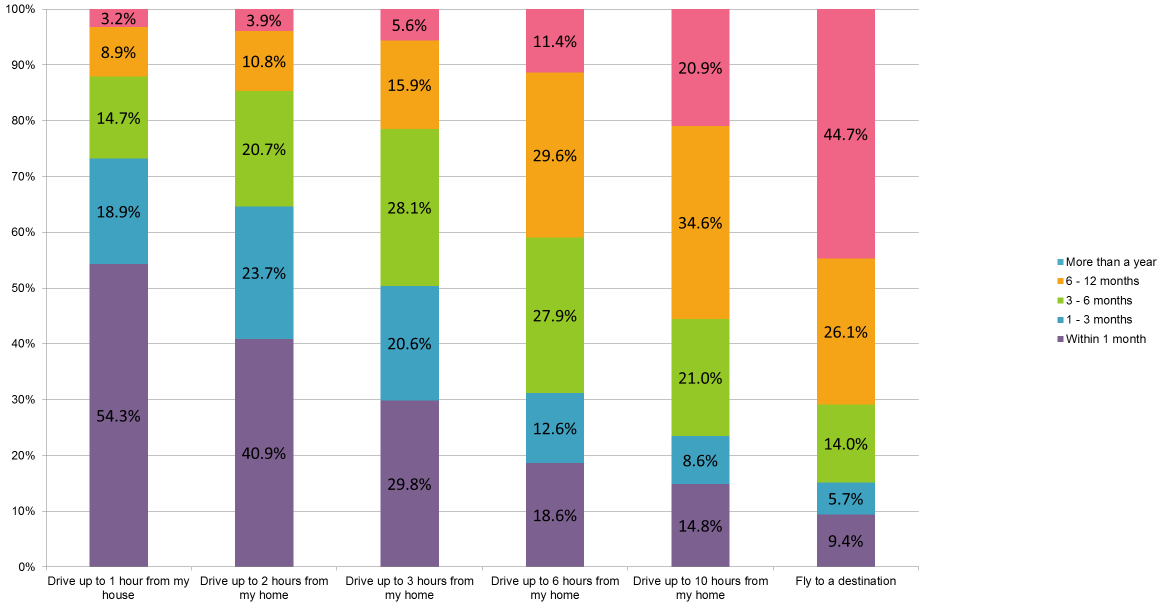
- Observation: Those willing to drive up to an hour from home within 1 month are now at 54%, 2 hours is 41%, and 3 hours is at 30%.
- Data Comparison: We have seen a substantial drop in the likelihood of travel in the next 30 days compared to the last survey. In the last survey, 1 hour was at 66%, 2 hours, was 54%, and 3 hours was at 40%. It is possible that seasonality is having an effect on these responses.
- Opportunity: The 1-3 hour drive market remains the most confident for traveling sooner rather than later. For the near future, targeting these consumers via email and paid search will yield the best returns.
- Resource: Fuel has developed A How-To Guide For Targeting Drive Markets
17. Which of the following would most likely persuade you to book a future vacation during the coronavirus outbreak? (Check all that apply)
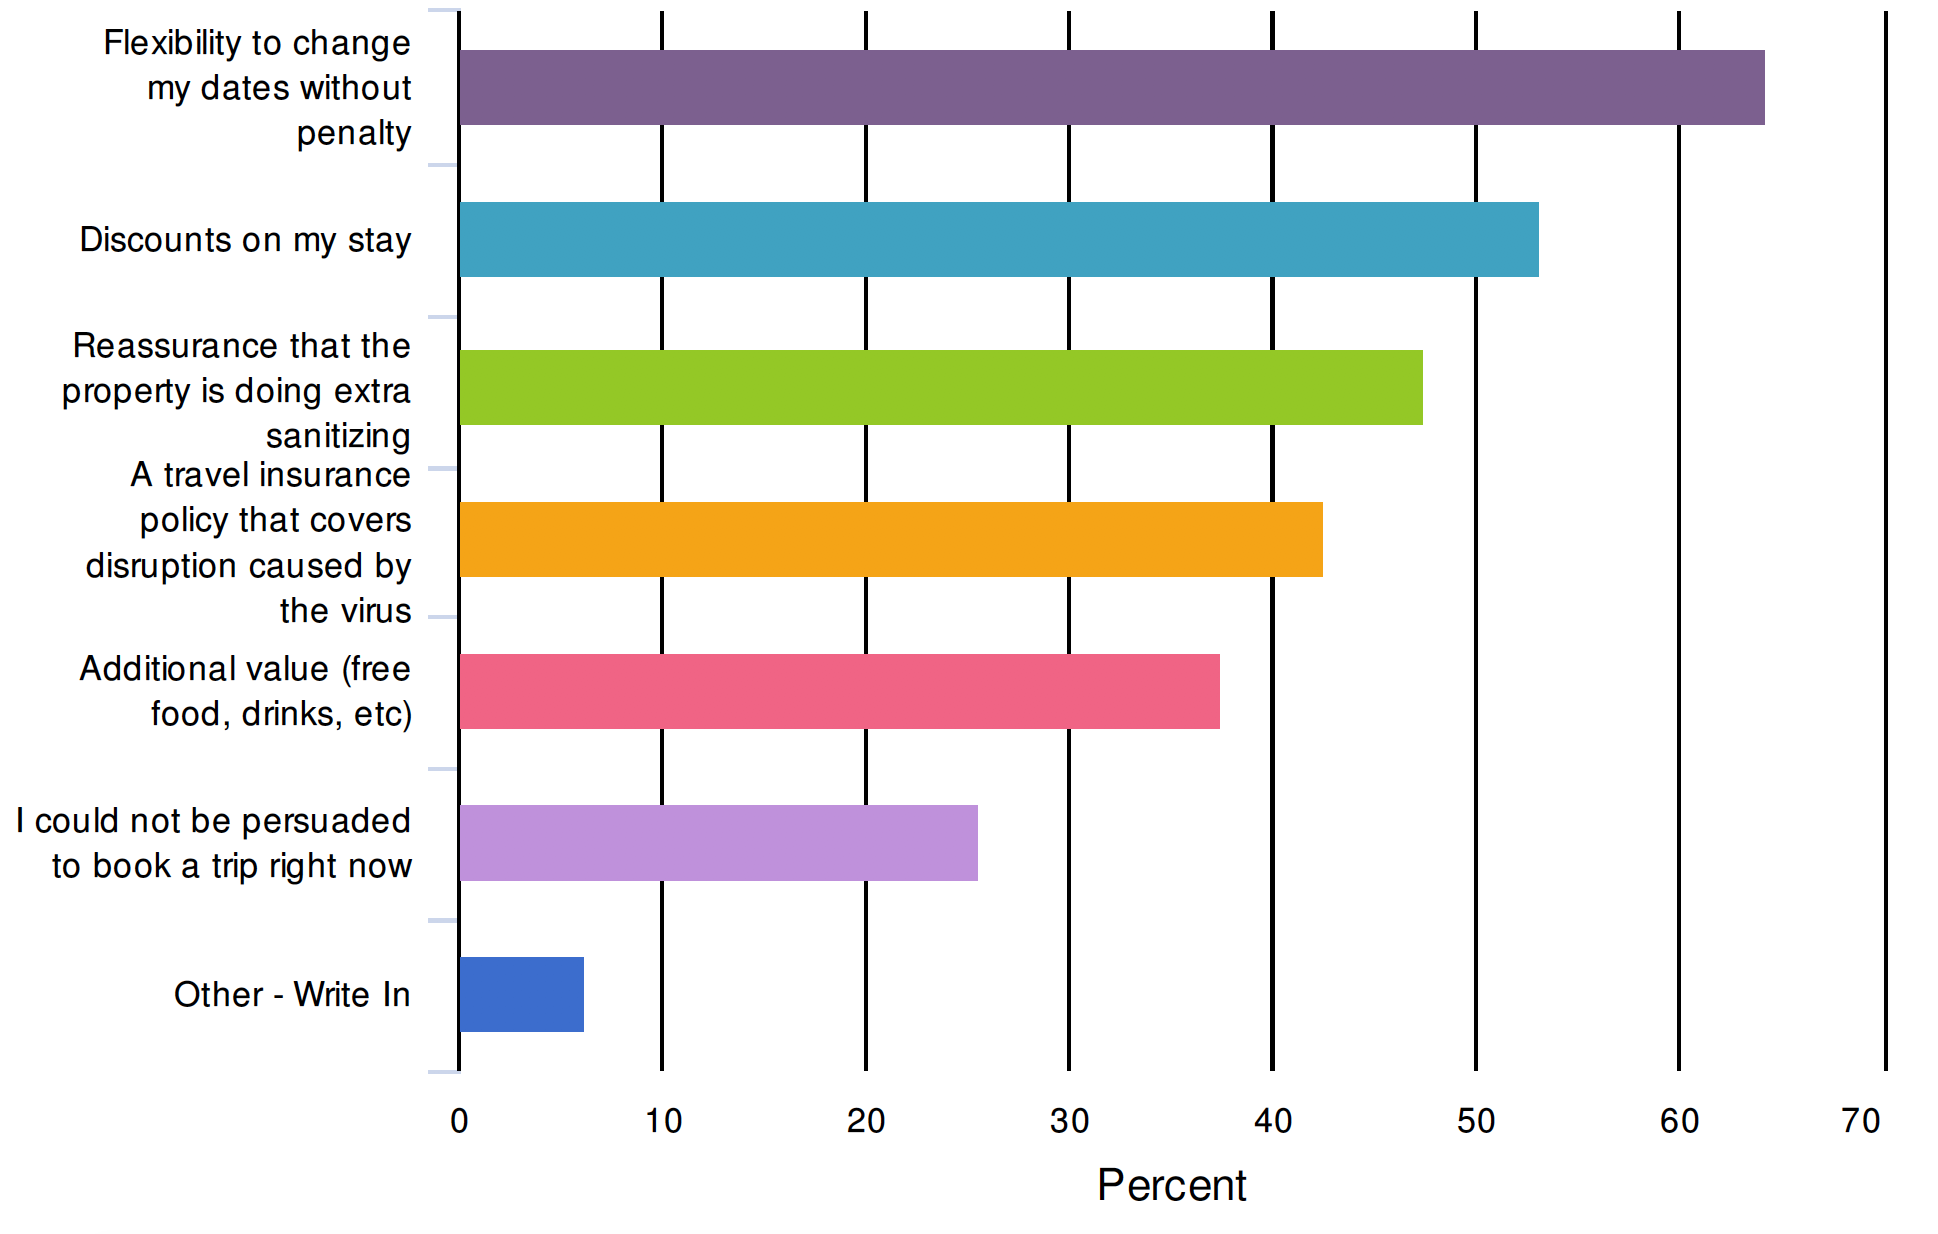
- Observation: 64% of people chose flexibility to change without penalty.
- Data Comparison: Flexibility had previously been at more than 70%. People saying that they could not be persuaded increased from 16% to 26%.Discounts on stays and reassurance of extra sanitizing remained in the #2-3 spots, however we are seeing a bigger gap between them in this round of the survey.
- Resource: Fuel put this article together on what types of policy changes and messaging you should be implementing right now: The Definitive Guide To COVID19 Policy Updates & Communication.
18. How would the following hotel protocols increase your confidence in staying at aproperty?
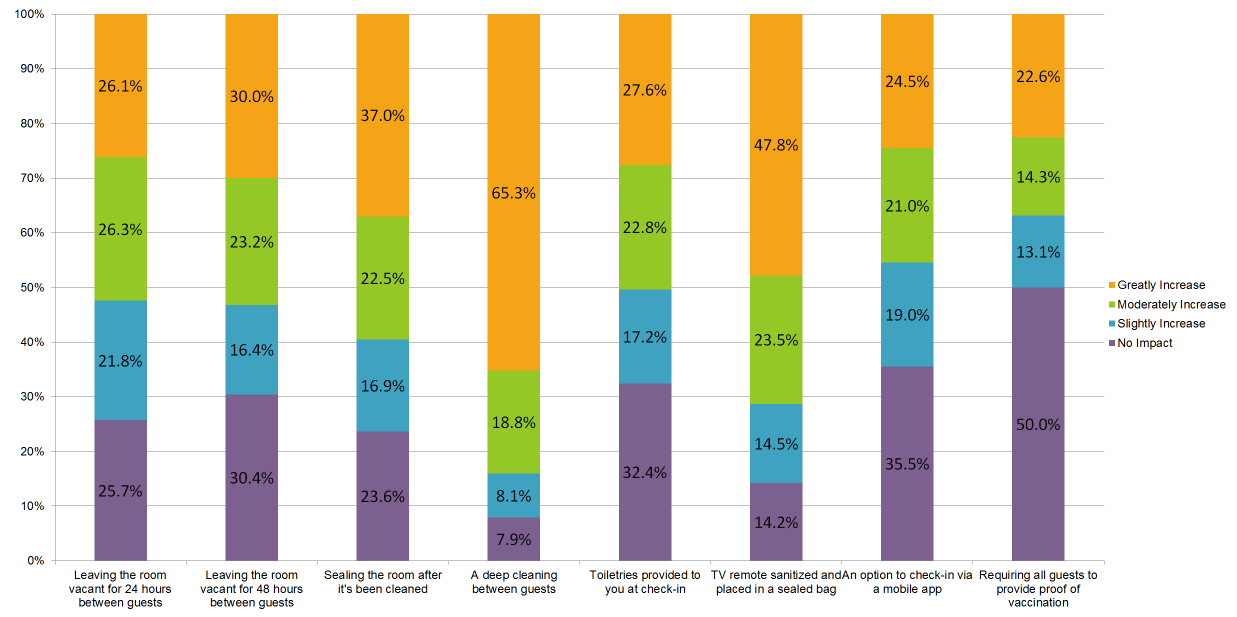
- Observation: Deep cleaning between guests, and placing the sanitized remote in a sealed bag had the biggest impact, with 65% saying deep cleaning would greatly impact confidence, and 48% for the remote.
- Data Comparison: There weren’t any major shifts in data since the last survey.
- Opportunity: Be crystal clear in your communication to guests and potential guests about cleaning protocols. Additionally, with the remote having such a strong response, if you are able to incorporate this small item into your operations, it would be of great value to guests.
19. I would like to hear from hotels on the following topics: (check all that apply)
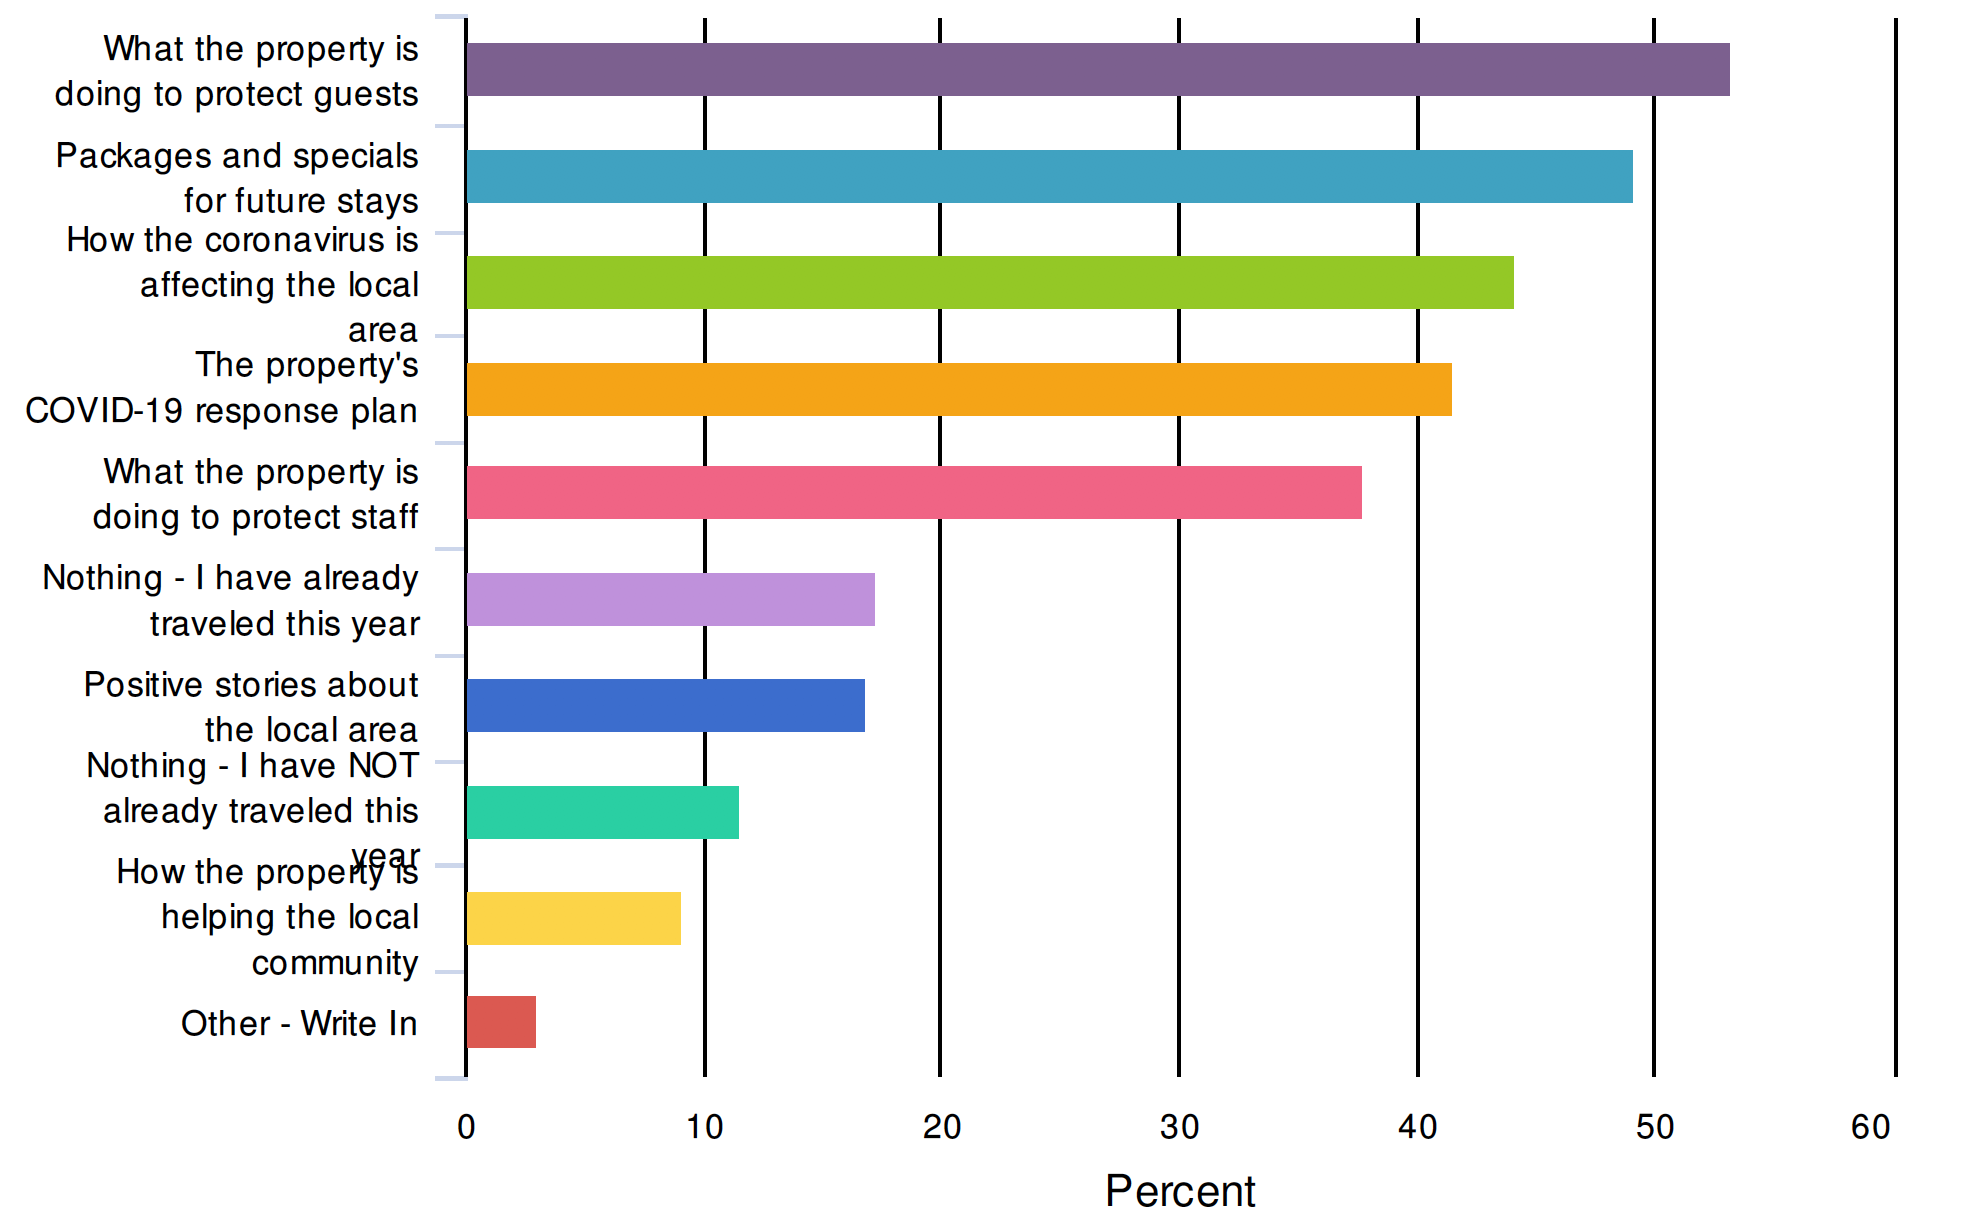
- Observation: Respondents continue to be more interested in learning about what properties are doing to protect guests than they are about receiving deals for future stays (53% vs. 49%).
- Data Comparison: Most data has had very little shift since the last survey. However, those saying that they don’t want to hear from hotels even though they haven’t traveled increased slightly, from 9% to 12%.
- Opportunity: For those consumers that want to hear from hotels, sending messaging with important information on their safety AND that provides value to them, and shows empathy, can keep your property top of mind.
- Resource: Having the right CRM system is critical to this success. Find out how to determine if you are ready for a new one, and for the best strategies for using your system to its fullest ability. Your CRM System Will Determine How (and if) Your Hotel Recovers From COVID-19
- Additionally, learn how to “hunt” those people who are open to hearing from you.
20. The next time you travel, which of the following would you wantthe property to communicate to you prior to your stay?
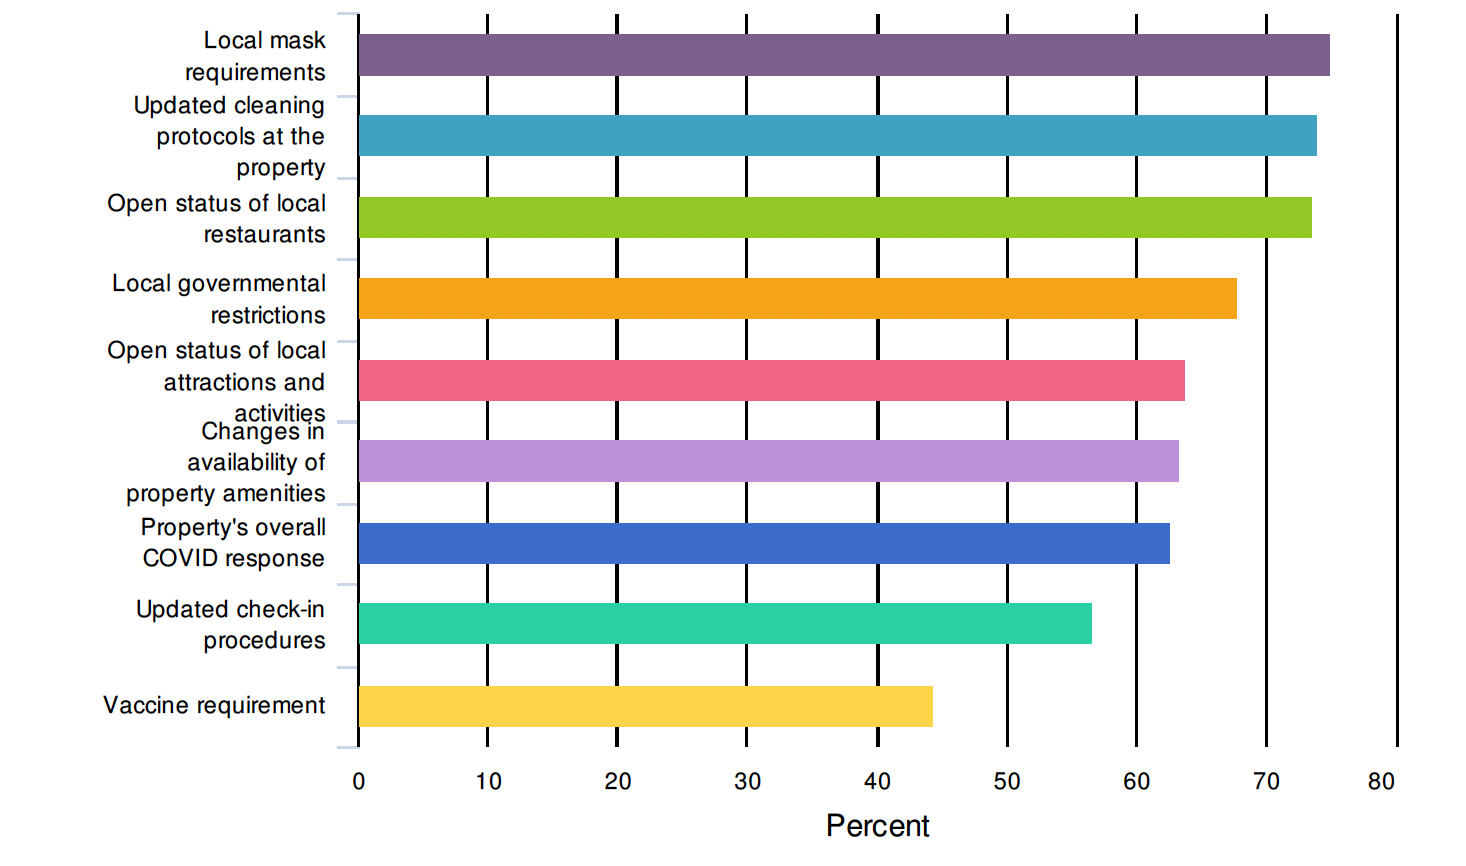
- Observation: 75% of respondents want to know local mask requirements, very closely followed by cleaning protocols at the property.
- Data Comparison: We added the category of “Vaccine Requirement” in this round, and had a 44% response rate. Open status of local attractions increased from 58% to 64%.
- Opportunity: More than 60% WANT to know the status of local restaurants and attractions, but based on previous survey data, just 35% of consumers have received this.
- Resource: We’ve covered some ideas on how to convey this information.
21. Complete the following sentence: I will travel when:
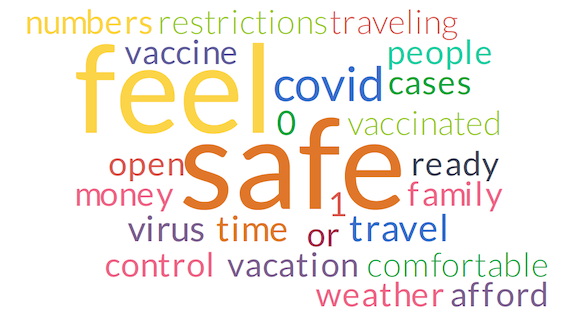
- Observation: “Feel safe” is most prevalent since we first asked this question. Phrases relating to a vaccine, number of virus cases declining have also been popular.
- Data Comparison: We did not see mention of “masks” in this round, which we had seen in the previous two sets of results.
- Opportunity: As mentioned before, whatever you can do to assure visitors that you have their well-being as a priority will increase your chance in convincing them to stay with you. Being cognizant of the financial stress many people are feeling, and providing value-add items to packages where possible will help consumers feel more comfortable booking.
Wrapping it Up
People ARE traveling, and nearly 70% of those who have traveled, have done so at least twice during the pandemic.
Consumers are likely to have more confidence in booking a trip next year once a vaccination has been administered (either to the traveler, the majority of the population, or those most at risk). Hoteliers need to be doing all they can to focus on potential guests located up to 3 hours away from the property. Communicating local safety ordinances, and status of local restaurants and attractions will continue to be very important.
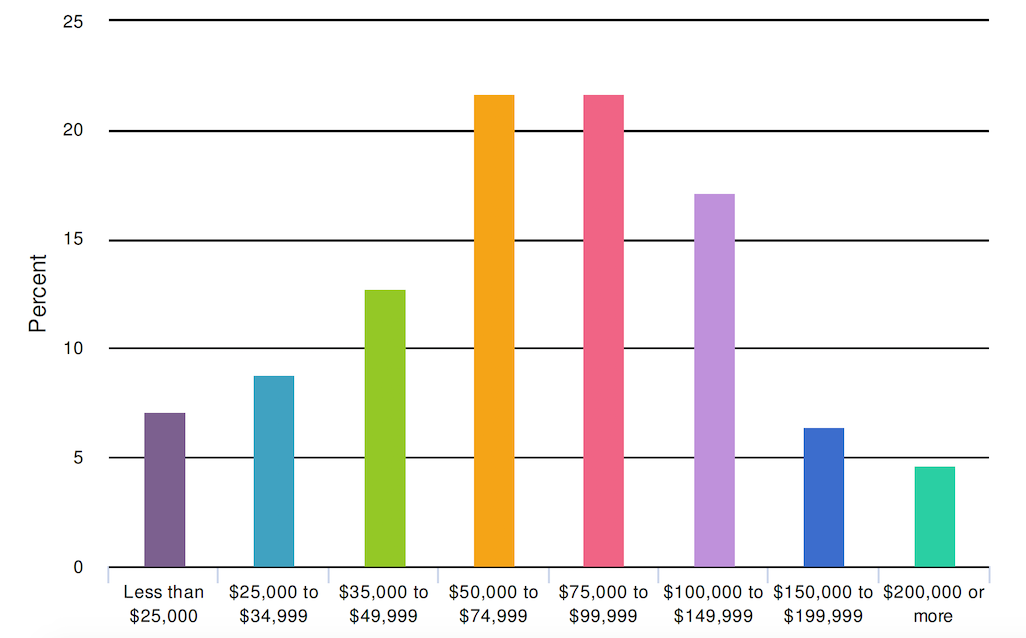
Survey MethodologyThis was a self-reporting survey sent to a database of leisure travelers located in North America. Questions containing multiple checkbox responses had the options randomized to avoid positional bias. More than 2,000 respondents completed all questions.
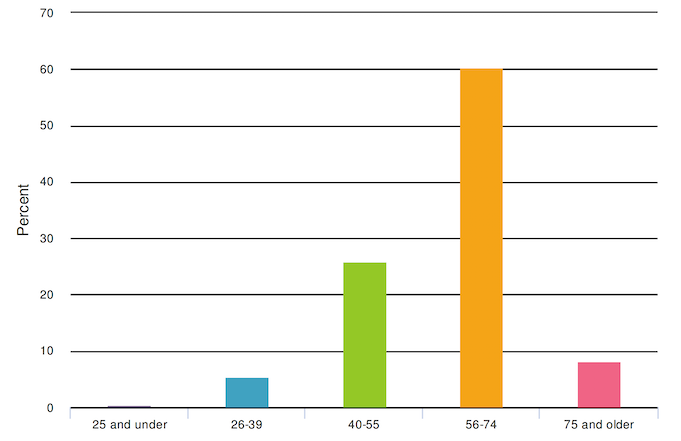
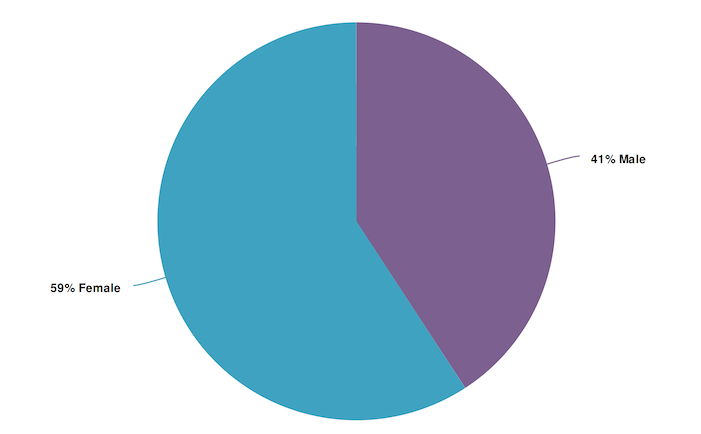
Below is the demographic breakdown of respondents.
Age & Gender:
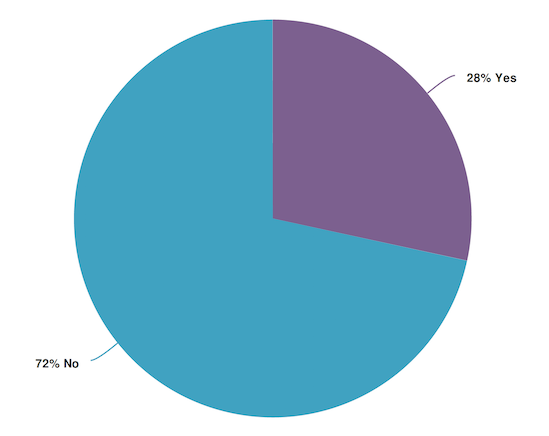
Do you have children living at home with you?
What was your total estimated household income before taxes during the past12 months?
